This paper features the SEIR model that can accurately calculate and predict the size of COVID-19 pandemic. Other than classical parameters, the model takes into account lockdown imposed by the government, age composition of the population, testing rate, inflow of patients (immigrants) and availability of tertiary health care facilities measured in terms of number of ICUs. The research takes an overview of then severely affected Italy and less affected India and studies the impact of parameters like availability of health care, testing rate and government-imposed lockdown on the number of infected, dead and recovered patients. The results presented through plots exhibit that for developed health care system, the number of recoveries will increase which is important in absence of vaccine. Also, for the control of this global pandemic the transmissions are being reduced. This is achieved by imposing the lockdown and restricting the movements of people which is studied in case of India. The model also predicts the number of patients in presence and absence of government-imposed lockdown for India and compares the two situations. The pandemic can also be controlled by detection of and quarantining infected patients. For the detection of infected patients, the testing rate needs to be increased which is depicted by plots.
COVID-19, SEIR model, Lockdown, Health care facilities, Treatment function
Within a short period of time, COVID-19 has shaken the world with a greater magnitude and coercion than older pandemics. Its eventuality is grabbed by the fact that it has infected millions and killed thousands across the globe. With each passing phase, the mortality rate witnesses new peaks with worst sufferers being the ones with maximum infectious and transmission rates. Global markets, accessible transportation, large scale production have largely contributed to make this pandemic spread faster. This has drastically affected the social life and health (mental and physical) of individuals worldwide. The challenge to counter this pandemic has been a global one with all the nations rising unequivocally in one tone. However, the approach taken by different nations differ extensively to contain this pandemic and minimize the damage in terms of morbidity and mortality rates. The already burdened health infrastructure across the globe is virtually exposed up to an irreparable point. The damage is further amplified by the extemporaneous approach of different countries that has made the situation grim and worse.
The WHO declared 2019-20 corona virus outbreak a Public Health Emergency of International Concern (PHEIC) on 30th, January, 2020 and a pandemic 12 days later on 12th February, 2020. With its outbreak in Wuhan, China, the pandemic seems to engross and encompass all the vitals of the world thereby affecting the mechanistic processes of any nation. The countries are trying hard to combat and contain this outbreak by following suitable set of protocols that tend to alter the transmission rate effectively. Local group and community transmission of the disease has been recorded in many countries resulting in large scale of infections and deaths. Depending upon the number of active infected cases, Italy is one of the worst sufferers of the pandemic with estimated 124632 infected cases and 15362 deaths (up to 4th April, 2020) [1] that tends to rise with each passing phase. Italy reported its first death on 24th, February, 2020. The factors governing COVID-19 have progressively increased its fatality rate across the country and have affected the potentiality of its health care. The increased measures taken by the Repubblica Italiana (Italy) to check and curb the ongoing virus started back on 11th March, when the whole nation (Italy) went under complete lockdown. The coercive measures have resulted in the disruption of all the necessary services and have laid strict focus on the already burdened health care of Italy. At this alarming rate, Italy can have the highest fatality rate in near future and can have the highest number of infected persons provided the treatment approach is not changed.
On the other hand, the case is virtually less severe in South Asia. Sharing its neighbouring border with China through buffer states like Nepal and Bhutan, India is less affected by the load of the COVID-19 disease. Being one the most populous nations of the world, India is fighting hard to minimise the damage of COVID-19. As on 4th April, the total number of infected cases in India were 3588 with 99 [1] number of deaths and most recoveries. India reported its first case on 30th January and entered the countrywide lockdown on 24th March, 2020 with constantly increase in number of COVID-19 cases. Indian state has issued early guidelines and travel advisories to limit the further damage of disease. Also, the timely precautions taken by the government have contributed greatly towards combating this pandemic.
As Italy and other parts are battling to combat this lethal virus, different fields across the globe are gearing up to come with methodologies that can determine the positive rates of this pandemic.
The paper attempts to devise a model that would conveniently help in assessing the predictability of pandemic COVID-19 in terms of exposure, transmission, infection and death rate within a specific time period. This can be achieved by evaluating the different parameters that directly or indirectly affect the ongoing rate of pandemic. Moreover, theoretical explanation, quantitative analysis and other parameters are highly required to predict the peak and size of any pandemic.
This section covers the formulation of SEIR model that is used to describe the outbreak of COVID-19. The utilization of the model lies in the fact that it focuses on the basic processes that are directly related to this growing pandemic. In the preparation of this model, the population was divided into six compartments or subdivisions which are discussed as:
• Susceptible subdivision S(t), it denotes the population which is susceptible to catch the virus.
• Exposed subdivision E(t), it denotes the population which is infected but the symptoms are not visible yet.
• Infected subdivision I(t), it denotes the population which has been infected by the virus and are showing the symptoms.
• Recovered subdivision R(t), it denotes the population which has immunity to the infection.
• D(t) is the population which has died due to the Corona virus.
• P(t) is the public perception of risk.
The basic assumption to formulate this model is that the recovered patients acquired permanent active immunity. It can be justified by the strong reason that none of the patients were re-affected by the COVID-19. There have been numerous cases where patients died after being discharged from the hospital but it was found that the patients were either discharged for having mild symptoms or the testing machine reported wrongly.
Consequently, the overall population of the country under study was taken as constant and the immigration rates were calculated before a country entered a lock down. The immigrants who returned from the infected areas (China) were taken as inmates of the country under study and were presumed to be more susceptible, infected and exposed than other already present in the country. The data from [1] shows that elderly population is severely affected by this deadly disease as such their proportion contributes more to infected compartment which is given in the model. Also, the testing has exhibited the number of patients infected but it doesn't affect the recovery and death counts as such it has been fitted in the model accordingly.
The model is written as:
Where,
a is the flow rate constant and N is the total population. β is the probability per unit time of transmitting a disease between two individuals in contact, λ is the contact rate, is the mean latent period, α is the disease-death rate, is the mean infectious period, T(t) is the treatment rate function which is the measure of health care system of a country, u, u+ and u- respectively represent total testing rate, positive testing rate and negative testing rate, 'h' is the rate constant for elderly population which has been the target of this virus, e is the proportion of severe cases and f is the public reaction constant.
In this case α will be calculated as the average value of daily death rate. The reason is that the disease death rate is fluctuating with every day. Here βλ is the transmission rate C. This C is established from [2] which are given as:
The reason for using the factor of 0.3 as coefficient to δ is that before lockdown everything was normal and people were free to make any type of movement in the country. After the lockdown the constant will take the value of -1 and this equation will take the form as:
With as transmission rate, δ as government strength constant and k as respond intensity constant [3]. The reason for adopting this transmission rate is that it incorporates the governmental action (Lockdown) and response of people due which the contact rate decreases with time.
The data for the Italy was either acquired by online sources like websites and other papers or was calculated with assumptions. The results and graphs were obtained using the MATLAB software.
For the testing rate 'u', Italy had done about 1005 tests per million of the population up to March 9, 2020. Out of the total tests carried out it was found that almost 5% turned out to be positive. This can be used to calculate u, u+ and u- This T(t) will be given as:
Where, 'c' is treatment rate. The value of will be calculated by next generation matrix approach discussed in [4]. The relation between and Reproduction number, by this method is given as:
with S0 as the initial susceptible population. The value of R0 is taken to be 2.6 [5]. Italy government applied the complete lockdown on 11th March 2020 as such Government action strength will take value of 0.6834 from the 11th onward but from 15th February 2020 to first lockdown date it will the value of 0.4239. These values are assumed to get more accurate values. The number of infected persons can reduce if a country has highly developed health care system which is reflected by the number of ICUs available for the patients. By [6] about 16% of the hospitalized patients required ICU facility but the number estimated in Italy is 12.5 per 100,000 inhabitants [7]. These beds are occupied by the patients for a period of about 28 days [8]. Estimating the fraction of patients served can give us the estimate of 'c' per 100,000 patients. The flow rate from China can be estimated from the date provided in [1,9]. The data has been provided for the year 2018 but it can be approximated to give the estimate of flow rate to Italy before the lockdown after which the flow rate will be equal to zero.
The Table 1 showing various parameters for Italy.
Table 1: Table with Parameters. View Table 1
The cumulative infected cases as up to 11th March 2020 are 10546 against the data of WHO which shows the cumulative cases to be 10149. Our model is accurate as it falls within the ambit of 95% of this figure. The comparison between these empirical figures yields a difference of 4% that can be accepted as least count error and doesn't impact the overall figures taken into account.
The approximation of the undertaken data corresponds to the genuine marginal error of 4%.
Similarly, the model generates and elaborates a death count of 618 up to 11th March 2020 against 613 of WHO showing an error of feeble 2% that is acceptable in terms of the overall figures of the cases. This deviation is again due to approximation of values taken into consideration.
After the lock down, the flow rate equals to zero and equation (8) is taken as the transmission rate function.
The cumulative cases up to 4th April 2020 as acquired by our model equals to 123632 against 124632 of worldometer which has the maximum deviation of only 1.3%.
The number of deaths acquired is 14431 against 15362 which is showing the deviation of about 6%. Both of these deviations, i.e.1.3% and 6% are possibly due to the huge variation of the figures on daily basis.
These results are plotted in the Figure 1 and Figure 2.
 Figure 1: Cases before lockdown.
View Figure 1
Figure 1: Cases before lockdown.
View Figure 1
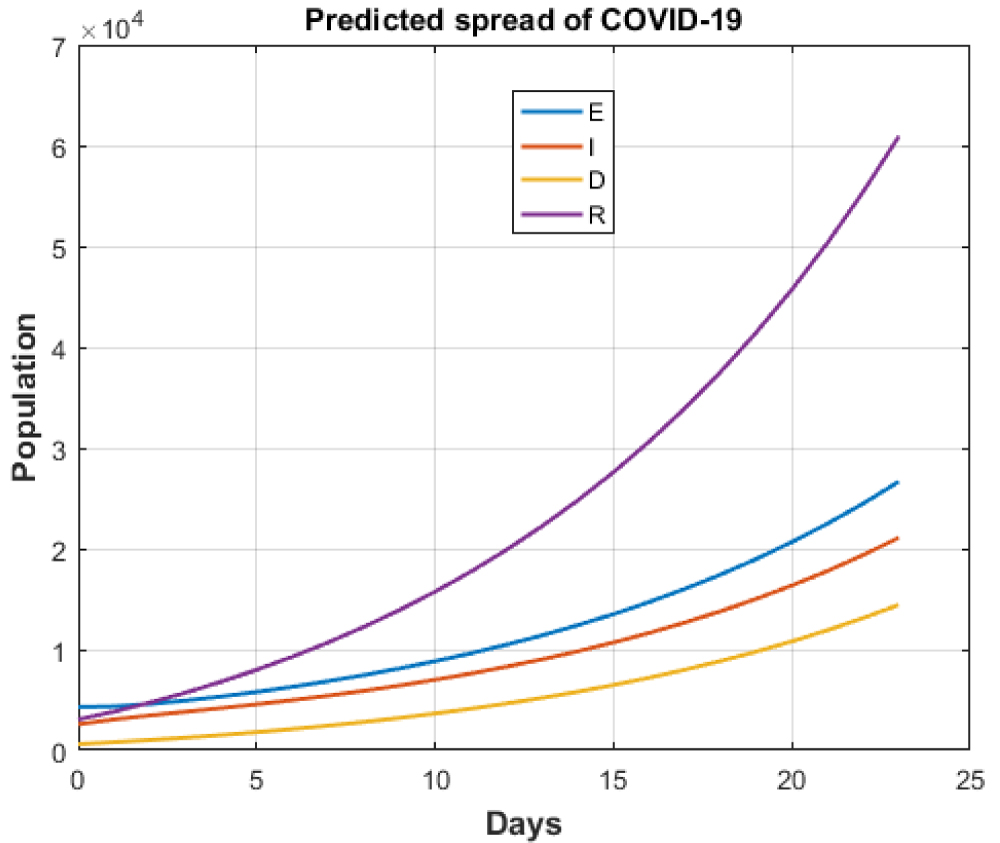 Figure 2: Cases after lockdown.
View Figure 2
Figure 2: Cases after lockdown.
View Figure 2
These results show the variation of health care facilities and the tests done by any country. These parameters have been discussed because of the following reasons:
There was no vaccine available up to the submission of this paper as such the recovery of the patients depended on the accessible health care facility of the country.
The control over the pandemic depends upon the detected cases of a country. These infected cases can only be detected and quarantined if the testing rate is higher for a given country.
In case of less developed health care system, the facilities like availability of ICUs and others to support the COVID-19 patients can be challenging. This effect of health care system has been studied by definitive ratios that display proper comparison of recovered to cumulative frequencies and recovered to death rates of patients.
These two ratios are Recovered to Cumulative Infective cases' and 'Recovered to Death ratio'. The 'Recovered to Cumulative Infective cases' and 'Recovered to Death ratio' have been plotted against time and the variation is shown in Figure 3, Figure 4, Figure 5 and Figure 6.
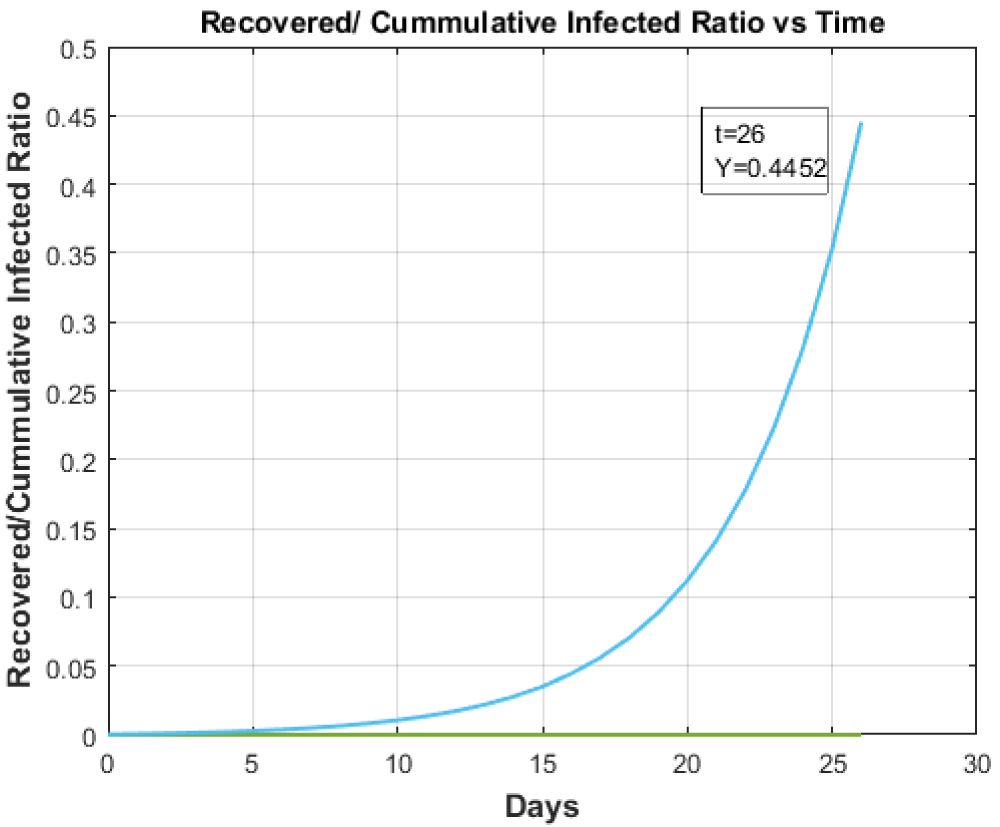 Figure 3: Supreselective angiography showing AVM node and embolized fistulous part of the AVM. Recovered to Cumulative Infected Ratio vs. Time for Health care of Italy.
View Figure 3
Figure 3: Supreselective angiography showing AVM node and embolized fistulous part of the AVM. Recovered to Cumulative Infected Ratio vs. Time for Health care of Italy.
View Figure 3
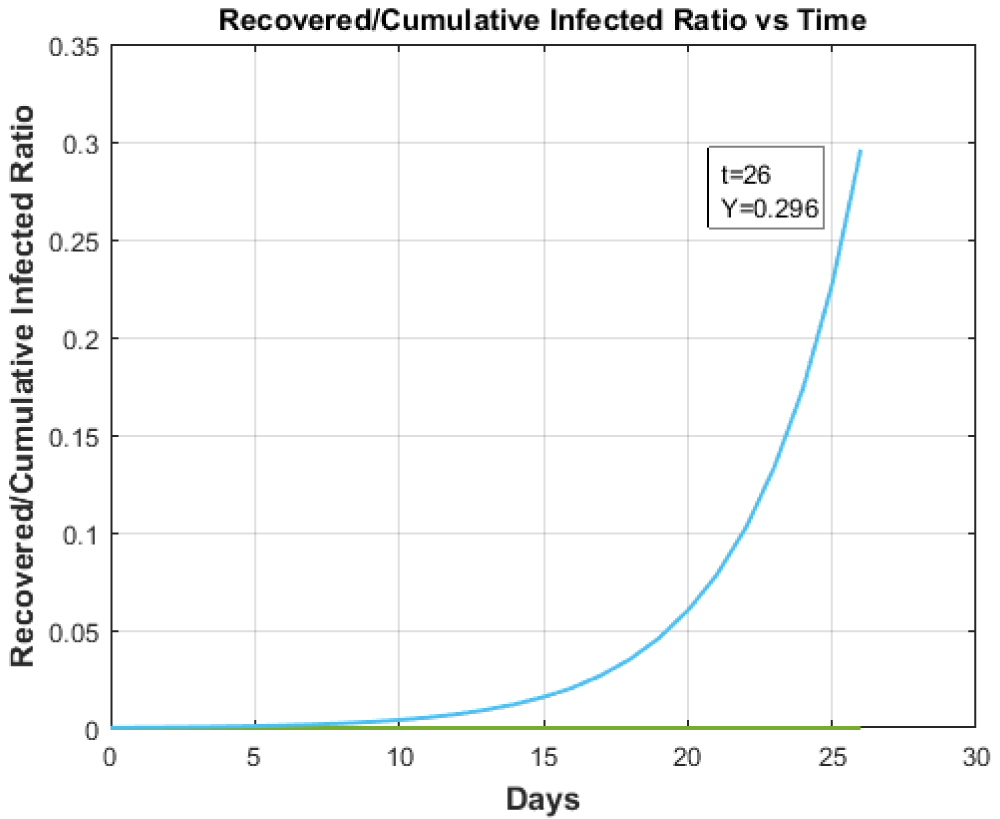 Figure 4: Recovered to Cumulative Infected Ratio vs. Time for any country with Healthcare facility less than Italy.
View Figure 4
Figure 4: Recovered to Cumulative Infected Ratio vs. Time for any country with Healthcare facility less than Italy.
View Figure 4
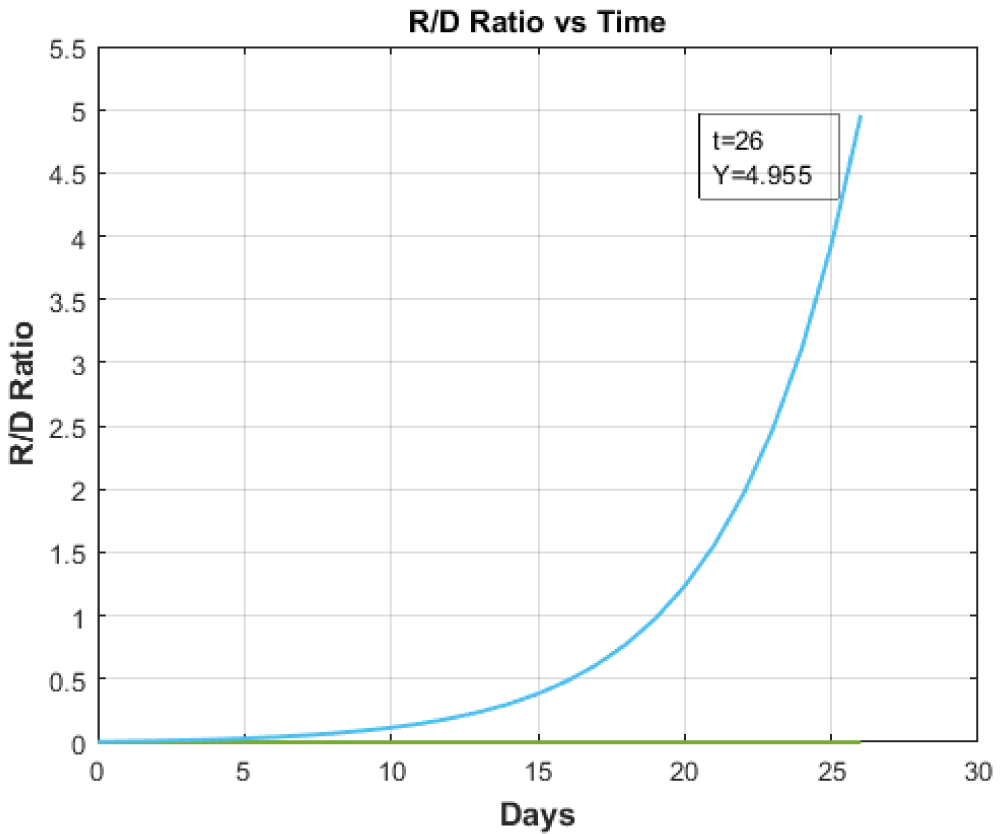 Figure 5: Recovered to Death Ratio vs. Time for Italy.
View Figure 5
Figure 5: Recovered to Death Ratio vs. Time for Italy.
View Figure 5
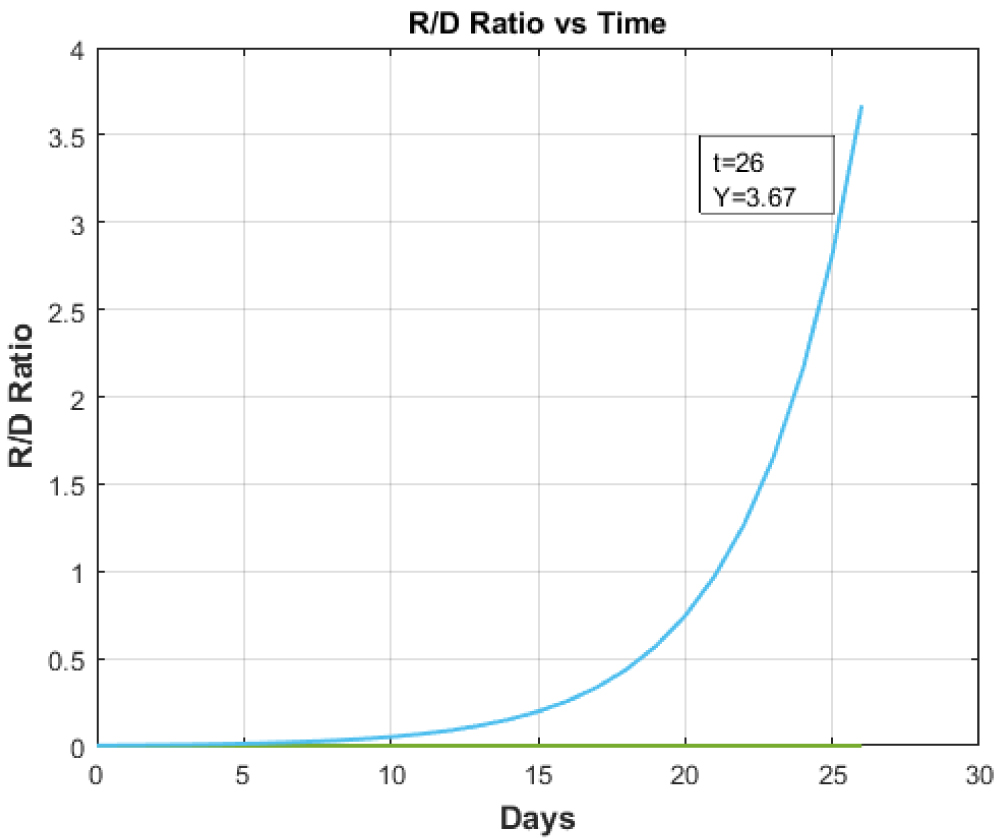 Figure 6: Recovered to Death Ratio vs. Time for any country with Healthcare facility less than Italy.
View Figure 6
Figure 6: Recovered to Death Ratio vs. Time for any country with Healthcare facility less than Italy.
View Figure 6
The Figure 3 shows the 'Recovered to Cumulative Infective Ratio vs. Time' in case of available health care of the Italy while Figure 4 gives the same plot for countries having less developed health care system than Italy. In this case, the hundred-fold reduction was taken for the study. Figure 4 illustrates that with the reduction in health care facilities, the ratio of Recovered to Cumulative Infective cases also decreases. It shows us the necessity of developed healthcare system to cope with this pandemic.
Figure 5 and Figure 6 respectively illustrate the ''Recovered to Death ratio vs. Time'. The above graphs clearly demarcate the essentiality of tertiary health care with highly equipped and full-fledged ICUs. The ICUs acts as prime indicators of tertiary health care that has been completely overburdened by this pandemic. So, the recovery rate of the patients depends upon the availability of tertiary health care vis-a-vis ICUs and other facilities.
The 'Recovered to Cumulative Infective Ratio vs. Time' and 'Recovered to Death ratio vs. Time' for given test rate and hundred-fold increase in test rate is shown Figure 3, Figure 5, Figure 7 and Figure 8.
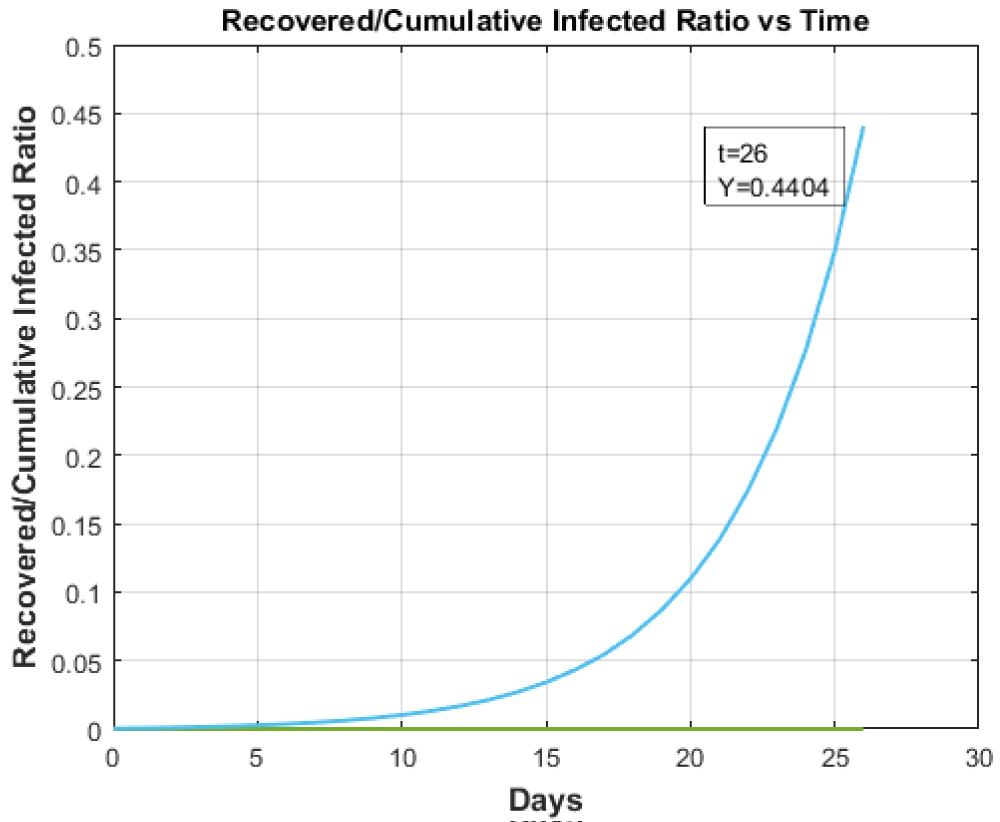 Figure 7: Recovered to Cumulative Infected Ratio vs. Time for hundred-fold increase in testing in Italy.
View Figure 7
Figure 7: Recovered to Cumulative Infected Ratio vs. Time for hundred-fold increase in testing in Italy.
View Figure 7
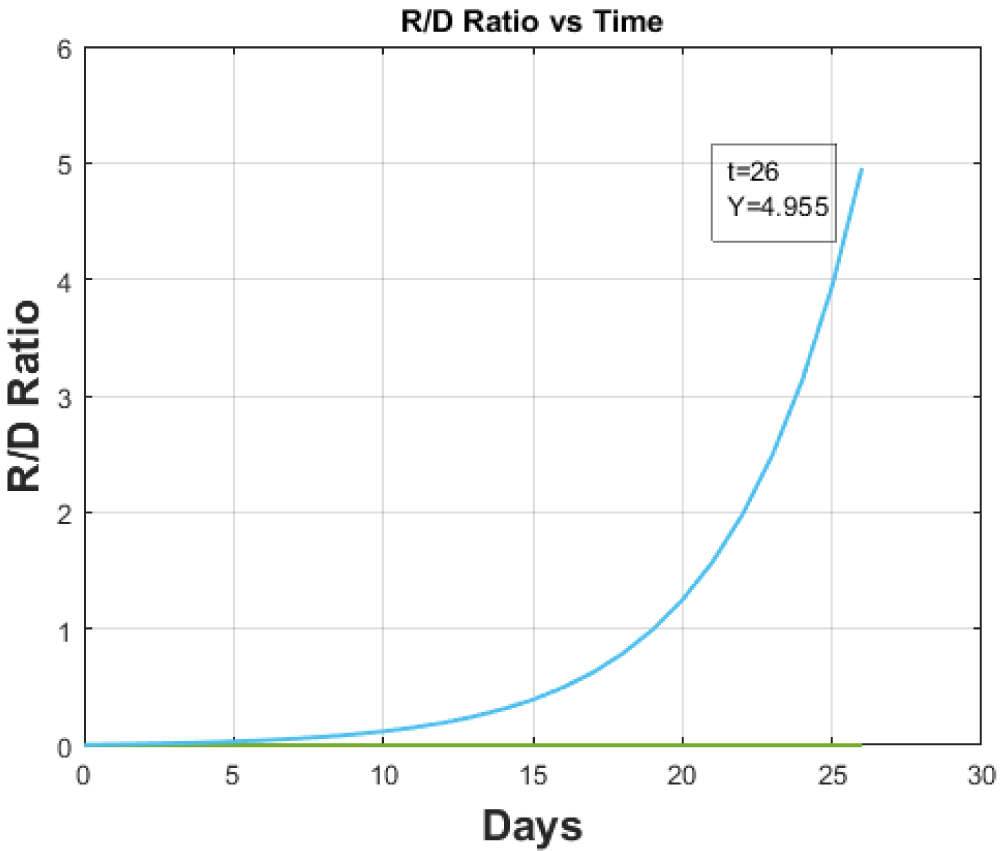 Figure 8: Recovered to Death Ratio vs. Time for hundred-fold increase in testing for Italy.
View Figure 8
Figure 8: Recovered to Death Ratio vs. Time for hundred-fold increase in testing for Italy.
View Figure 8
For normal testing the 'Recovered to Cumulative Infective Ratio vs. Time' plot is shown in Figure 3. The increase in testing rate will directly impact the frequency of infections thereby decreasing the overall ratio of 'Recovered to Cumulative Infectious ratio' as is validated in the Figure 7. The testing doesn't impact the overall recovery and death rate of patients as such the Recovered to Death ratio which is illustrated in the Figure 9 remains unchanged.
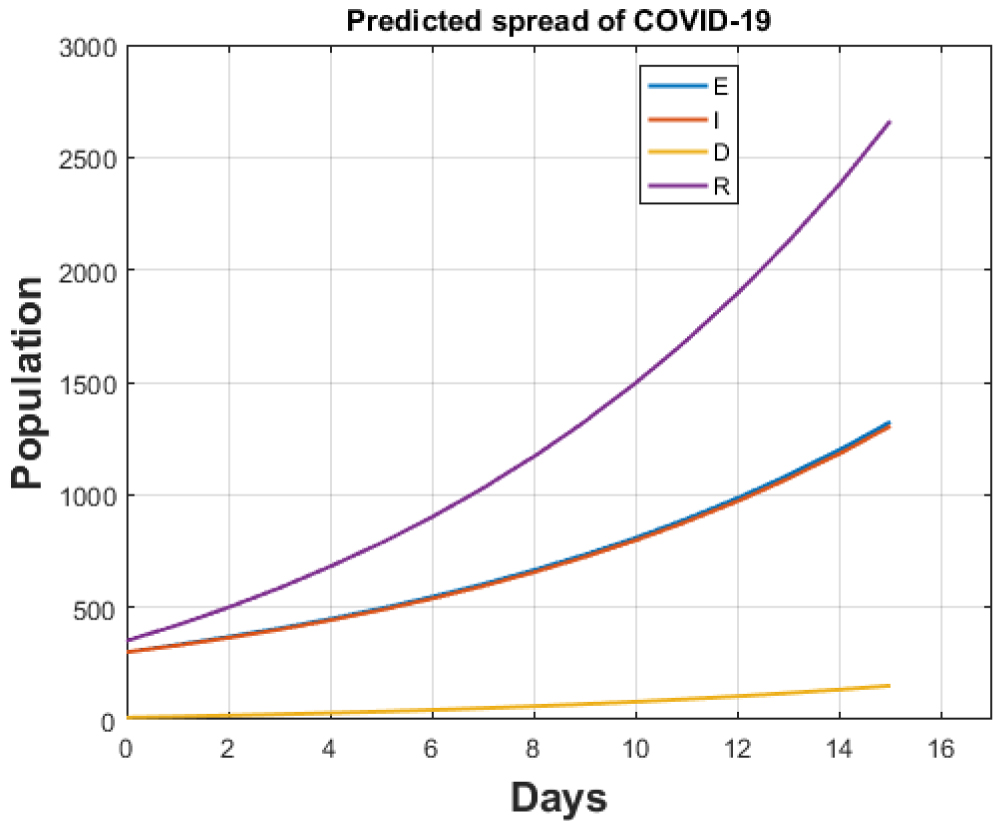 Figure 9: Total cases for India after lockdown.
View Figure 9
Figure 9: Total cases for India after lockdown.
View Figure 9
The study shows that countries should implement large scale testing that can serve as a prime controller of infection by reducing the magnified transmission of the COVID-19. The testing can be properly applied to minimise the infected persons by decreasing the contagious rates of the infection.
India has steadily shown a faint growth in Corona cases from the very beginning of this global pandemic. The initial precautionary measures employed by India have contributed to their smaller rate in number of infections.
The Government of India announced the lock down and ban on social gatherings very early. Also, the number of cases directly varies with testing. The lesser testing rates than other developed nations (Italy) have significantly paved way for lesser affected individuals. This sequential model applied to India shows the impact of total lock down with zero flow rate. Also, the curves will be established only after the lockdown period with zero flow rate into the country. The necessary precautionary measures taken by the government serve as vitals to this study. These include immediate lockdowns, banning social gatherings, maintaining physical distances and others. It has eventually localised the affected patients by reducing their movement thereby containing and avoiding the transmission to a larger scale.
The total number of tests done in India up to 5th April 2020 was 128320 [1]. Out of the total, 2% turned out to be positive [10]. These figures give us the estimate of u and u+. As per [11] the elderly population proportion has increased to about 6.18% up to 2018.
The proportion of old age is 6% in India and is increasing by a magnitude of 0.2%. These two percentage values have been utilized to calculate the "elderly population constant" (h) for the given population. As on 5th April 2020 no case was declared to be critical [1]. So, the proportion of deaths that took place during this time was taken to be seriously sick due to this virus. India owns about 100,000 ICUs [12] for its total population. So, for every 100,000 patients with the assumption that 10% requires the ICU facility, the value of 'c' can be estimated.
The Table 2 showing data for India.
Table 2: Table with Parameters. View Table 2
This section strictly deals with the timely lockdown-effect undertaken by the authorities so as to minimize the contagiousness. The study takes under consideration the prevailing and stretching lockdown situation and predicts the cumulative cases in absence of this government imposed lockdown. The lockdown period may be extended depending upon the number of new infections and is thus referred to as stretching lockdown.
The cumulative cases up to 8th of April as predicted by our model are 5442 against [1] which gives this count to be equal to 5360. Also, death count is predicted by our model to be 152 against 160 of [1]. If the lockdown continues, our model predicts that the cumulative cases after one month will rise to 13220 while the death count will elevate to 3475 accordingly which is very small in comparison to already infected nations. Both results are shown in Figure 9 and Figure 10.
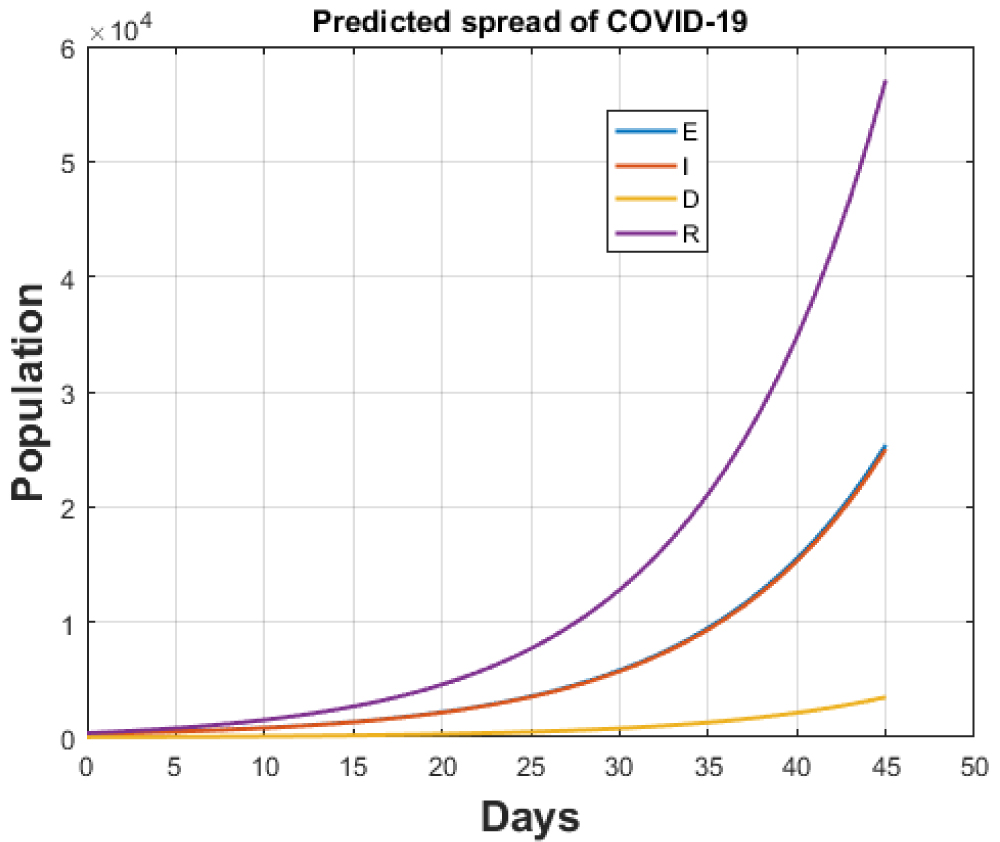 Figure 10: Total cases for India after continuing lockdown for one month.
View Figure 10
Figure 10: Total cases for India after continuing lockdown for one month.
View Figure 10
In case the government ends the lockdown after 14th April, 2020, the transmission rate function will take the form of equation (7).
This will allow the movement of people with ease making the transmission rate amplifies by a magnified number that can be alarming. If, the ban on the international flights continue and the death rate remains same as 0.0138, the model predicts the estimation of 6641881 new cumulative infected cases within a month and number of deaths will be equal to 13191. The numbers predict that the infected cases would multiply by a factor of 50 and the number of deaths would maximize by a factor of 4 if the lockdown is lifted. The results are shown in Figure 11.
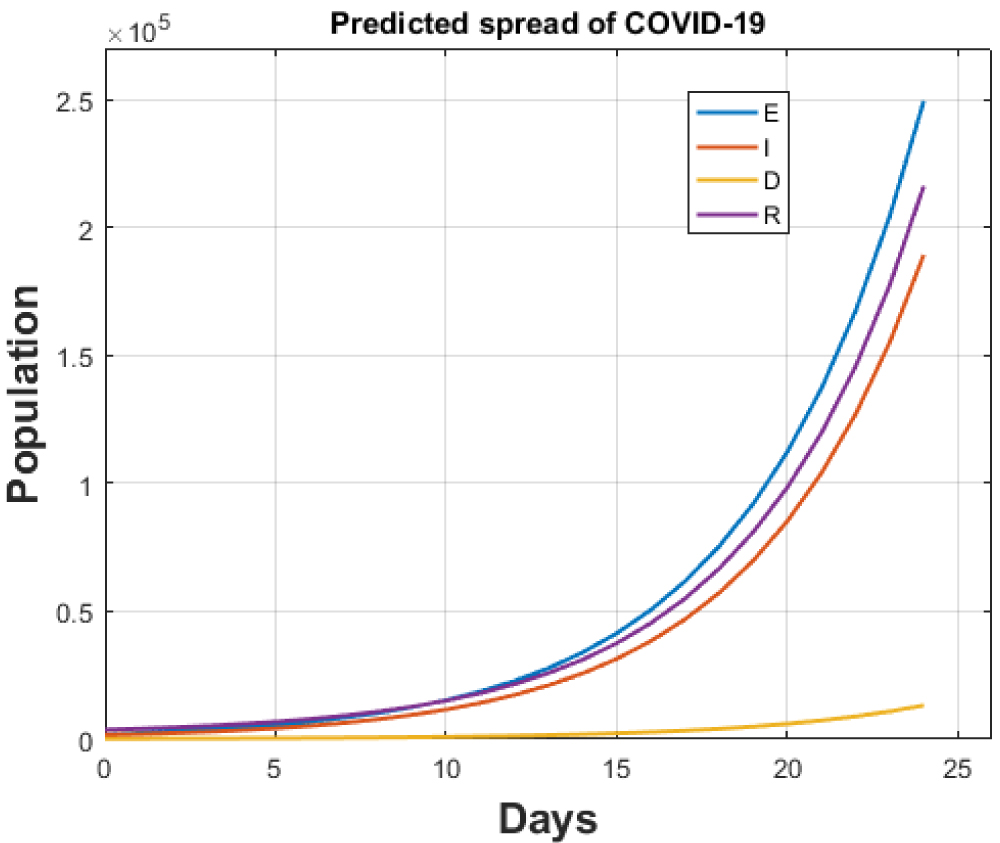 Figure 11: Total cases for India without lockdown after 14th April, 2020.
View Figure 11
Figure 11: Total cases for India without lockdown after 14th April, 2020.
View Figure 11
The specificity of the SEIR model used clearly highlights a dominant relationship between the different variables used for this study. This makes a clear distinction between the timely methods employed by the authorities of one nation against the untimely methods not employed by the other. The results show a passiveness of the rates that vary differently against each other. Moreover, the contextualization of rates created a coherence of results obtained by applying the approximate data available on different databases. The model establishes a causal relationship between the preventive measures taken by the authorities with the dominant variables like number of infections and number of deaths. The scale of pandemic keeps varying with each passing phase due to the fluctuations in magnitude of cases varying worldwide and specifically with countries. The model maintains a balance of parameters (their approximation) used by predicting the size and growth of pandemic largely. The results lay emphasis on the significant measures taken by the Government authorities in different corners of the world and the importance of developed health infrastructure. This gives an overview that number of recovered patients will significantly rise with the available health facilities like number of ICUs. The lockdown effect has been properly analysed and shows a specified degree of variation in number of infections with changing death and transmission rates. This clearly demonstrates that the increased number of deaths were probably due to non-availability of particular health facility.
The implications of lockdown are clearly visible by the paralytic effect of a country that decreased the magnitude of transmission among population. This led to the lower number of infections and possible deaths in the time frame used. Also, the quanta of testing rates determine the possible number of infections. The testing rates employed by the countries under study show a significant difference. As per the results of this study, the testing rate needs to be quickly increased to check the growth of COVID-19 patients for India. This study has attempted to evaluate the estimated figures of this pandemic genuinely and obtained the results on the basis of different parameters analysed. Also, the remodelling can be established upon this model for the future studies.
The project was not funded by any organization.
The authors declare that they have no competing interests.
No individual person's data was collected and used in the study as such no ethical approval or individual consent was applicable.
Data is available online while the analysis was done in MATLAB.
Every author contributed equally.