Reactive Oxygen Species (ROS) in spring/summer air and water reach germicidal levels. It is proposed that variations in naturally occurring ROS are the primary cause of influenza seasonality. Recent NIH and DHS COVID-19 aerosol and droplet log kill measurements do not account for this natural germicidal effect leading to over estimations of half-life for the virus in real world conditions. A new formulation of the Wells Riley equation is proposed that includes ROS and viral load factors. It is proposed that minimum ROS levels in the air we breathe, water we drink, and from sunlight our body absorbs need to be provided in our homes, offices, schools, and hospitals especially during fall and winter months to reduce the probability of transmission. The effectiveness of this defensive ROS reservoir is compromised especially in heated and cooled enclosed spaces, resulting to new pathways for disease spread. Changes in building codes and regulations appear to be required.
Reactive oxygen species, Flu season, Viral load, Infectious dose, Electron spin resonance, Wells-Riley, Ventilation, Disinfection
In nature, infectious disease transmission occurs in a highly suppressive environment containing germicidal levels of reactive oxygen species (ROS) such as hydrogen peroxide, ozone, hydroxide ions, etc. As illustrated the Figure 1. At the microns scale of a cough droplet containing thousands of viral particles, the virus particles must pass through a gauntlet of germicidal molecules to infect the next host. This germicidal effect is not included in existing experiments, models, and governing equations leading to fundamental misconceptions regarding how infectious diseases spread.
 Figure 1: Droplets containing virus particles in the air and on surfaces interacting with sunlight and solar generated ROS (real air).
View Figure 1
Figure 1: Droplets containing virus particles in the air and on surfaces interacting with sunlight and solar generated ROS (real air).
View Figure 1
As can be seen the relative motion of the cough droplet through the ROS laden atmosphere determines how quickly ROS molecules accumulate in the droplet. For a typical cough or sneeze droplet this leads to half-lives for the virus particles in the droplet of less than 1 second in real air. Droplets on surfaces have longer half-lives because the surrounding ROS molecules are consumed and replaced at a much slower rate in stagnant air.
Naturally occurring Reactive Oxygen Species (ROS) are misunderstood in part because too little is bad, too much can be very bad, and in-between is essential for life. The body generates a variety of ROS to combat pathogens, signal other cells, and as byproducts from processes like ATP synthase [1-3]. Not only are ROS used for sustaining life, they are our primary means of disinfecting against viruses and other pathogens [4]. As an example, for over 20 years the disinfection industry has safely used 10 to 40 ppbv ROS hydrogen peroxide on a continuous basis in occupied hospitals, offices, and homes [5]. Similar levels of naturally occurring hydrogen peroxide (1 to 5 ppbv) is generated by the sun every spring and summer at higher latitudes and year-round at lower latitudes. Sunlight is the primary source of most of the natural ROS used by our body either indirectly via the air we breathe and water we drink or directly via our exposure to the Sun. Zimmerman and Reiter [6] show that the Sun generates a wide range of ROS in the human body and provide a methodology to quantitatively estimate the three-dimensional ROS distribution in the human body generated from natural sunlight and artificial sources. That work is extended here to include exogeneous ROS sources both natural and artificial.
Natural ROS are primarily formed by sunlight interacting with the atmosphere and consist of both oxygen and nitrogen ROS. For the purpose of this article ROS will be inclusive except where distinction is needed.
As would be expected at higher latitudes ROS levels drop significantly in the fall and winter months as shown for hydrogen peroxide in Figure 2 [7]. Similarly, the amount of hydrogen peroxide in freshwater lakes is seasonal as shown in the Figure 3 [8]. Figure 3 also illustrates that sunlight is driving this seasonal effect. In general, more data is needed for all the ROS in the atmosphere and water supply.
 Figure 2: Seasonal variations of H2O2 in the atmosphere.
View Figure 2
Figure 2: Seasonal variations of H2O2 in the atmosphere.
View Figure 2
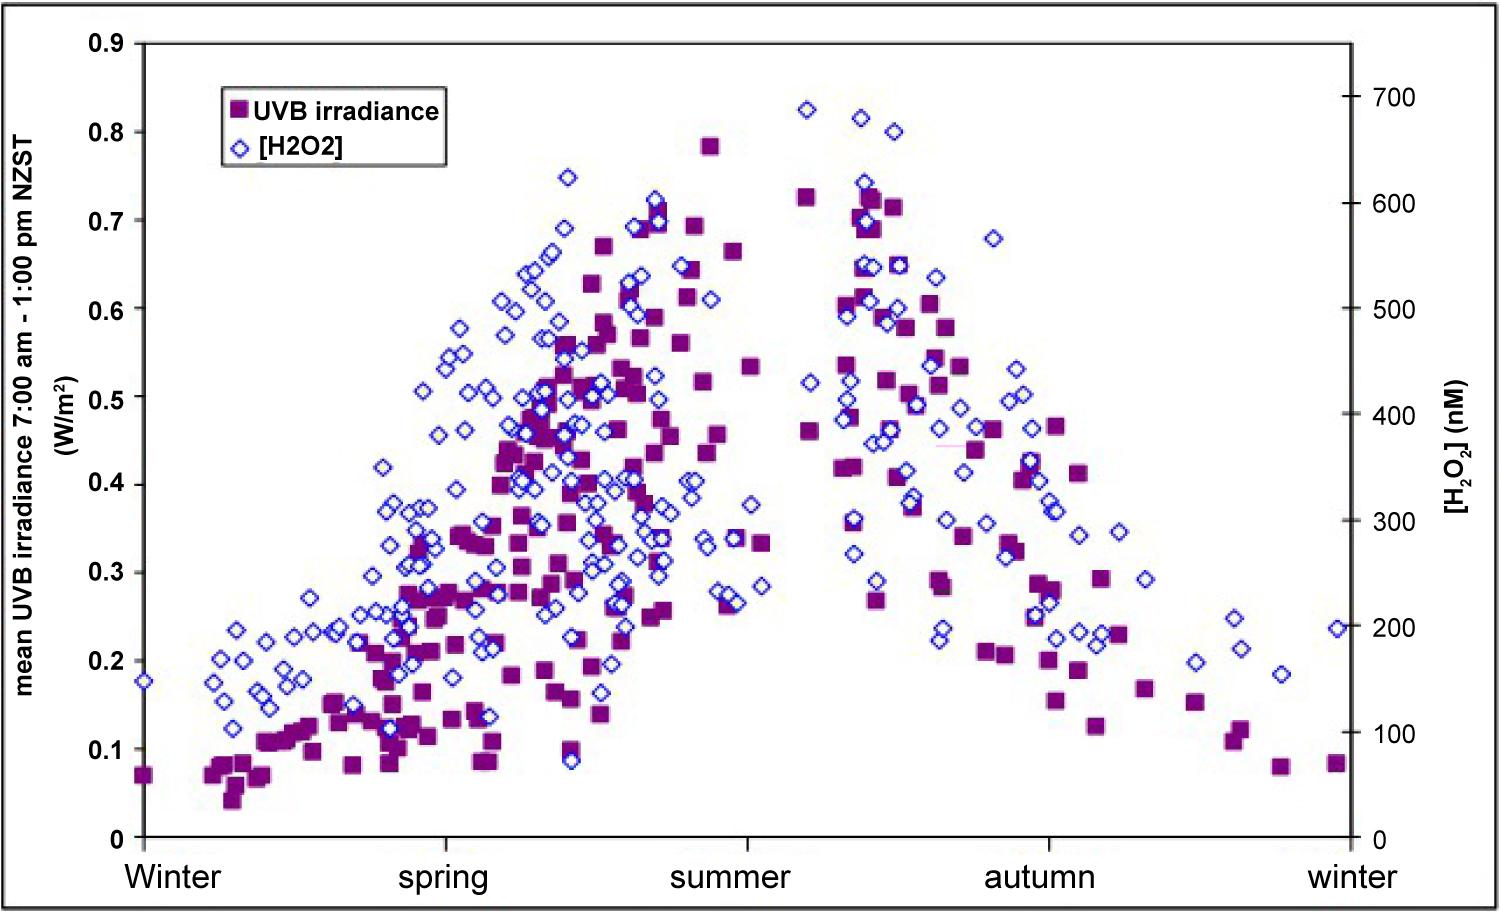 Figure 3: H2O2 seasonal variation in surface water and UVB in New Zealand.
View Figure 3
Figure 3: H2O2 seasonal variation in surface water and UVB in New Zealand.
View Figure 3
The spring and summer natural ROS levels shown above, are similar to artificial ROS levels used effectively by the disinfection industry to locally kill viruses, germs, and molds. While there has been substantial research supporting intermittent localized protection in an office or building the scope of this paper is to look at whether continuous ubiquitous low level natural ROS or lack thereof plays a role in infectious disease spread and mortality on an epidemic or pandemic scale.
As shown in Figure 4 compares monthly death rates for seven epidemics/pandemics between 1945 and 1975, all exhibited strong seasonality with 90% of the deaths occurring between Nov and April.
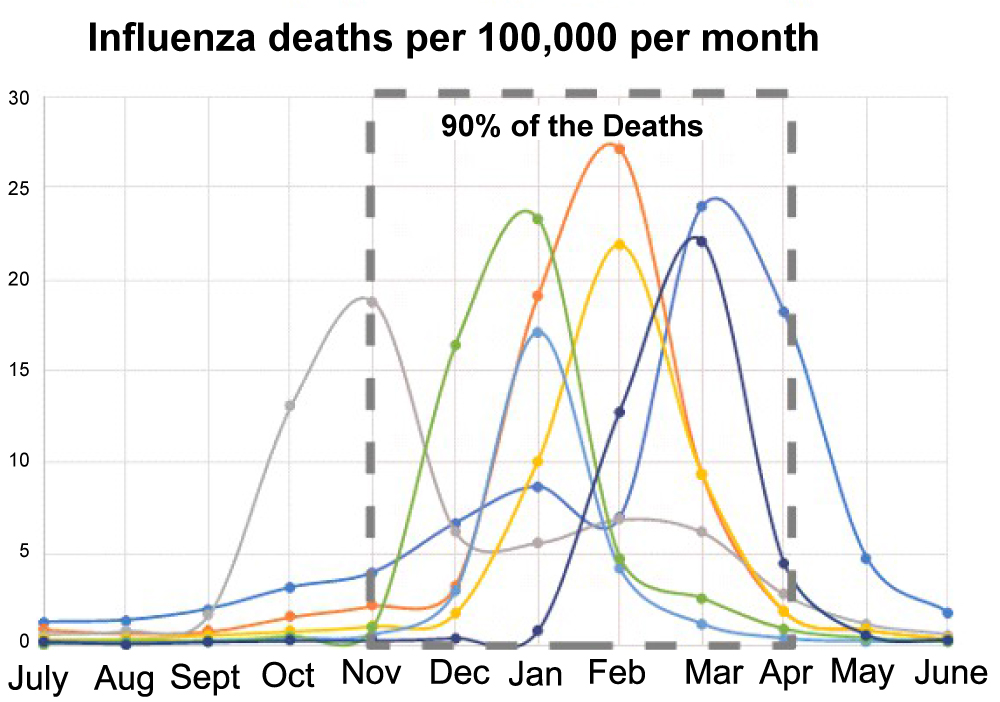 Figure 4: Seasonal influenza death rates.
View Figure 4
Figure 4: Seasonal influenza death rates.
View Figure 4
It has been stated by Dr. Dowell [9], "If we knew what suppressed influenza to summertime levels, that would be a lot more effective than any of the flu vaccines we have". -Scott Dowell, Bill and Melinda Gates Foundation.
The literature provides several possible reasons for why many pandemics are seasonal including closer human to human contact, reduced immunity from lower Vitamin D levels, and increased droplet spread due to humidity differences [10]. It has also been proposed that the influenza virus prefers lower temperatures and humidity [11].
Enclosed space with heating and air-conditioning, stagnant air, dry air, low E glass window treatments, lack of daylighting, rainy seasons, heavy snowfall, and man-made air pollutants like sulfur dioxide strongly deplete solar generated ROS levels [12]. In general, urban areas with elevated air pollution levels have much different ROS compositions than rural areas. An historical study of the 1918 pandemic appears to support the premise that high levels of man-made ROS (presumably SO2) from coal fired plants in urban areas at the time were a major factor in higher urban mortality rates compared to rural areas [13]. This was at a time when the society was much less mobile possibly accentuating the difference between urban and rural areas.
Recently Bourouiba [14] modeled that COVID-19 could spread greater than 20 feet. This however did not include germicidal effects in the air. While tidal breathing appears to introduce as many viral particles into the air [15], coughing and sneezing dynamics is important because they extend the exposure range in artificial atmospheres like our homes and offices. ROS like hydrogen peroxide exhibit levels that can seasonally reach 5 ppbv as previously discussed. This is roughly equivalent to 1017 molecules per liter of air. As discussed by Marsden [5], a simple model assuming a uniform distribution of hydrogen peroxide molecules creates a gauntlet of ROS molecules spaced approx. 1 micron apart. It has been well studied that as a droplet travels through any atmosphere it will gather up increasing amounts of ROS as shown by acid rain simulations and measurements [16]. A simplistic calculation shows that a 10 micron droplet traveling 6 feet would interact with over 100 million hydrogen peroxide molecules at 10 ppbv. It has been estimated that up to 108 viral particles are contained in each cough [17]. The point is simple, fresh air kills more viruses than air containing no ROS. This mechanism forms the basis of modern-day vapor phase disinfection. The majority of the industry is focused on higher ppmv ROS levels to quickly and economically disinfect rooms between patients. At these elevated ROS levels the rooms must be sealed off during the cleaning phase which typically can last of over 1 hour.
As shown by Marsden [5] a sneeze traveling through 10 ppbv hydrogen peroxide atmosphere kills 99% of the viruses in the sneeze droplets within a meter. Given sneeze velocity are greater than 20 m/s, half-life of less than a second appear realistic for the condition where droplets are in motion within low level germicidal atmospheres.
If there are 108 viral particles killed in approx. one cubic meter using 10 ppbv hydrogen peroxide containing air (1020 hydrogen peroxide molecules per cubic meter), the ratio of v (virus particles) to R (ROS molecules) is.
While a rough approximation it does illustrate quantitatively the density of ROS through which the virus particles must pass even at low ROS levels. As a reference point, EPA safety standards limit hydrogen peroxide to 1000 ppbv for an eight-hour time weight average of exposure, 50 times the concentration used by the disinfection industry and 200 times the level we live in every spring and summer.
Presently, ASHRAE and others do not require a minimum ROS level and only specify a certain number of Air Changes per Hour (ACH) which ranges from 12 ACH with 3 "fresh air" exchanges for operating rooms to prevent accumulation of anesthesia gases to 0.35 ACH for residential buildings to suppress body odor. Financially, each additional ACH can cost between $150 to $250 a year in energy costs per hospital room.
An underlying assumption is that only dilution is occurring and that the air we breathe is not actively killing the virus. While VHP systems are used in some hospitals, yachts, and homes they are typically open loop and not tightly controlled due to the lack of cost-effective sensors. In many cases they are used to suppress odors and reduce allergy effects. If the hypothesis is correct at least in the fall and winter or during pandemics providing minimum ROS levels in the general population might provide a method to prevent or suppress the onset of flu season. While over 1 million hydrogen peroxide systems have been installed in the United States, that represents only a small fraction of the building space in use [5]. DOD studies during the recent anthrax scare demonstrated that COTS cool mist vaporizers containing 8% hydrogen peroxide could be effective if run over extended periods of time. It should be noted that most VHP disinfection systems are designed to use high ppmv levels to quickly disinfect a room for the next patient as previously discussed.
If minimum ROS levels are to be generated, it is also important to consider the load factor effects for artificial sources. ROS like hydrogen peroxide are constantly being consumed. A single RGF PHI™ unit can take several days to generate 20 ppbv hydrogen peroxide levels in a 1500 square foot home based on generation rate and consumption of the hydrogen peroxide [5]. High usage areas can be quickly depleted unlike natural ROS sources. Due to the lack of cost-effective pptv level sensors it is difficult to guarantee minimum ROS level. In general, the need exists for metrics that include both dilution as well as natural and artificial ROS sources.
In most hospitals, negative air pressure and a certain number of air exchanges are used to reduce the probability of the staff being inflected. The Wells-Riley equation [18] has been used since the fifties to estimate the probability of infection in hospitals and buildings determining the number of air exchanges needed in a room.
Where, I is the number of infected people in the room, q is the rate at which infected people in the room produce quanta, p is the rate at which the infected people breathe, and Q is the flow rate in the room. Based on the desired probability of transmission the equation predicts the number Air Changes per Hour (ACH) required. An underlying assumption is that the room air is simply removing virus particles not actively killing them. The factor q is derived from epidemiological data for various diseases and conditions. It can range from 1 quanta/hour to 1000 s of quanta per hour for different diseases making it very sensitive to the specific pathogen.
As discussed by Sze To and Chao [19] dose-response variations of Wells-Riley have been used to estimate tuberculosis infection rates by replacing q with the number of airborne tuberculosis bacilli released per infector per unit time G and β the deposition of infectious particles in the alveolar region.
Using similar rationale, it is proposed that:
Where, v is the viral load (virus particles released per infector per m3), qR is a scaling factor, i is the infection dose (virus particles), and R is the ROS density (ROS molecules per m3). Substituting into the equation yields;
As discussed by Rudnick [20] q is a complex mixture of many variables. The more measurable variables specific to a given disease that can be pulled out of q the tighter the range will be.
A stationary isolated droplet containing thousands of virus particles within a germicidal atmosphere interacts with only a limited number of ROS molecules. If there is no air movement the surrounding ROS quickly become depleted. That same droplet in motion (sneeze) interacts with millions of ROS molecules as the droplet travels through the atmosphere as discussed previously. It is also known that copper and brass surfaces interact ROS like hydrogen peroxide enhancing germicidal effects. New minimum air flow requirements may be required to reduce probability of transmission.
As shown in Figure 5 environmental conditions dramatically impact half life of viruses. Aerosol measurements based on Goldberg cylinder test equipment in dark dried ROS free air indicate COVID-19 can have a half-life of over 1 hour. Exposing the aerosol to sunlight reduces the half life to less than 90 seconds. As previously discussed, a sneeze droplet traveling through a ROS atmosphere (10 ppbv hydrogen peroxide) with an average velocity of 24 m/s appears to have a half life of less than 10 milliseconds. This is due to the harvesting effect discussed previously.
ROS also have half-lives that can range from nanoseconds to days. Unlike photons that cannot be stored, ROS can accumulate, stored, dispersed, and in general used by the body in wide range of biological processes.
In the summer or at low latitudes, virus spread is proposed to be taking advantage of alternate exposure pathways. Air-conditioned spaces mimic the dark room condition of Figure 5 by limiting fresh air and sunlight in homes, offices, and hospitals. As most transmission occurs indoors it is not surprising that these alternate pathways encourage viral spread even at lower latitudes despite natural germicidal mechanisms.
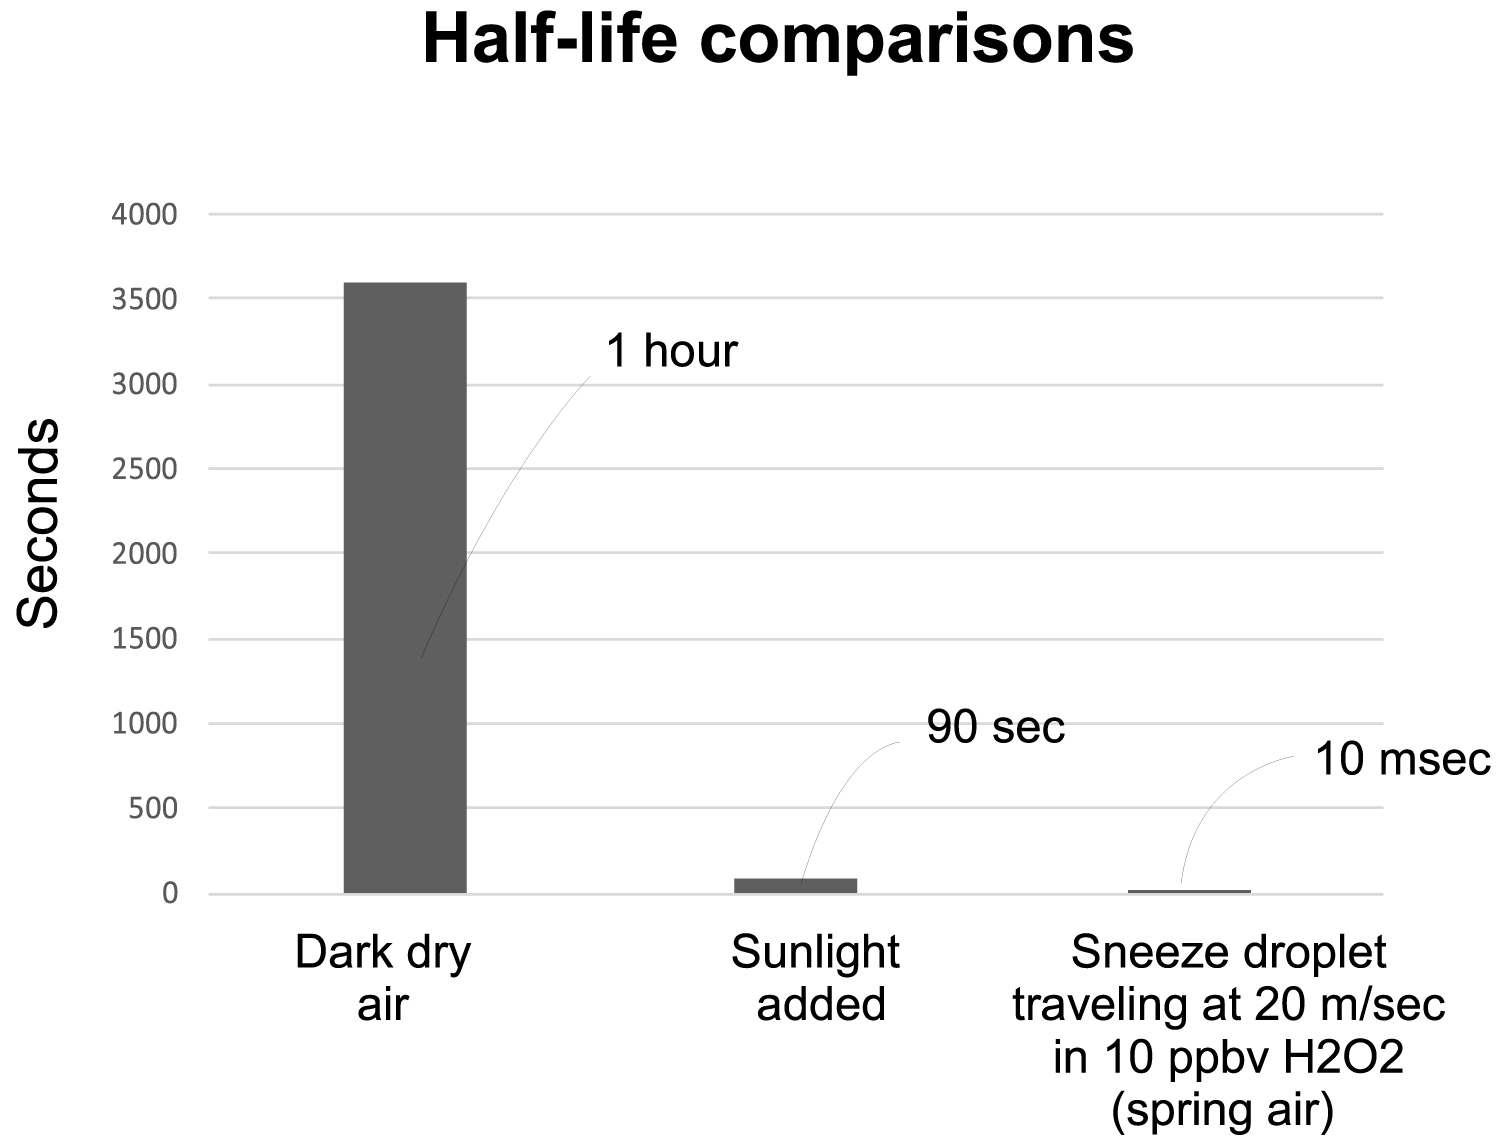 Figure 5: Impact of environment on virus half-life.
View Figure 5
Figure 5: Impact of environment on virus half-life.
View Figure 5
In general, nature provides a ubiquitous low-level germicide in the fresh air we breathe and water we drink at levels that appear to reduce the probability of transmission to a level sufficient to stop most epidemics. From this perspective epidemics start when these naturally occurring germicidal levels drop in the fall and winter.
The average person inhales about 500 liters of air per hour. Based on the previous discussion, that means that in fresh air approximately 1019 molecules of hydrogen peroxide travel through the airway to the lungs every hour. Given that the cells in the nasal passages release hydrogen peroxide in response to pathogens [21] it would appear reasonable to suggest that low level ROS treatments may be beneficial at suppressing the total number of viruses in our lungs. Anecdotally, a teaspoon of 3% hydrogen peroxide per cup of water in vaporizers has been used for decades to treat respiratory illnesses mimicking springtime ROS levels.
In general, most of the literature is focused on the negative effects of man-made ROS in air pollution. A large body of work exists regarding the role of sunlight on Vitamin D levels [22].
Unlike the air we breathe and the water we drink, sunlight directly forms large quantities of ROS in our body as discussed by Zimmerman and Reiter [6] and it has been proposed that the resulting ROS stimulate the body’s natural defenses resulting in an enhanced antioxidant reservoir based on melatonin and other antioxidants. In order to test this hypothesis, it becomes necessary to quantify the ROS levels generated in the body by sunlight and artificial sources. As shown in Figure 6 we can estimate the average number of photons at each wavelength required to generate a single free radical using Electron Spin Resonance data by Zastrow [23].
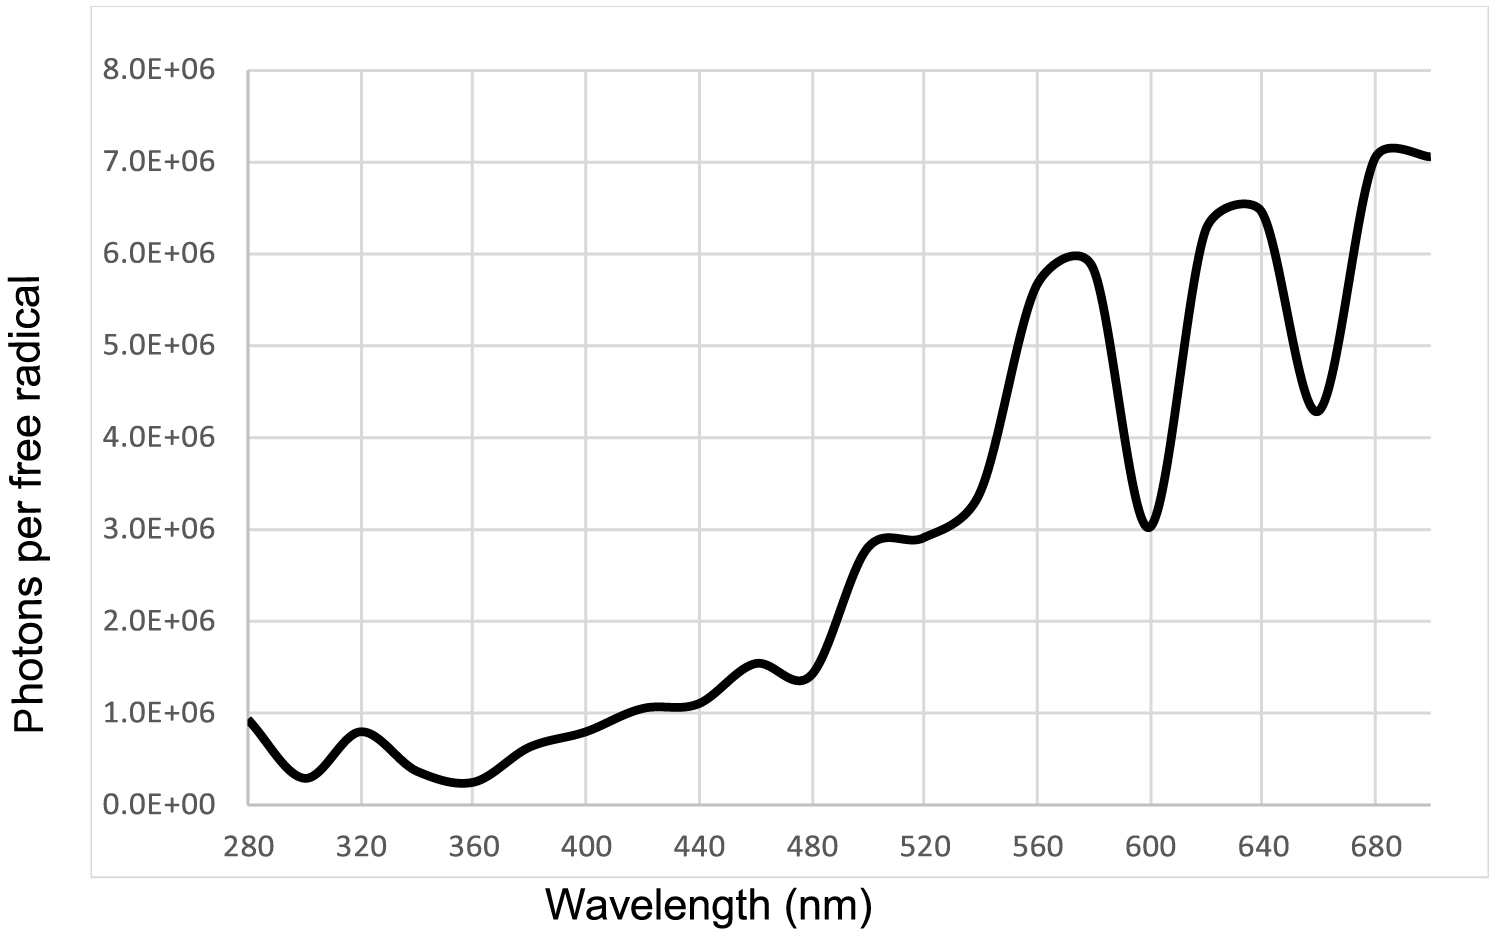 Figure 6: Action spectrum for free radical generation from 280 nm to 700 nm.
View Figure 6
Figure 6: Action spectrum for free radical generation from 280 nm to 700 nm.
View Figure 6
Using these action spectra, it then becomes possible to determine the ROS levels. As shown in Figure 7, three light sources emitting the same total number of photons per sec per cm2 of exposed skin area create significantly different ROS levels in the body.
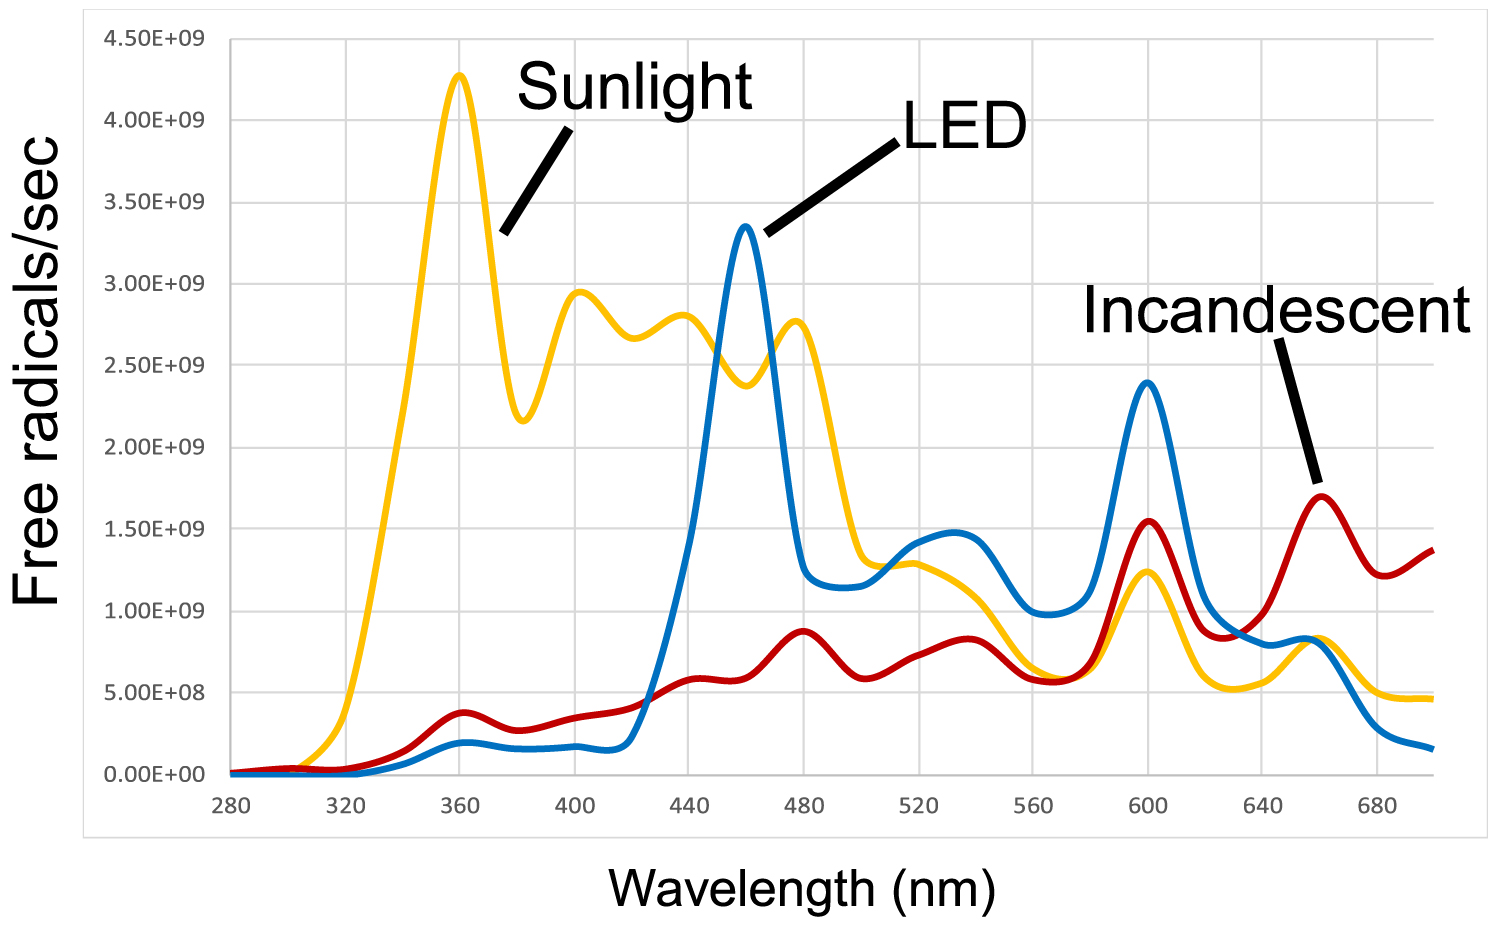 Figure 7: Free radical/sec generation rates for 3 different light sources.
View Figure 7
Figure 7: Free radical/sec generation rates for 3 different light sources.
View Figure 7
Combining this with optical ray tracing models which predict where each photon is absorbed in the body, it is possible to estimate the three-dimensional ROS distribution in the skin, eye, brain, fetus, etc.
As examples, in the wavelength range of 320 nm to 420 nm the photons are absorbed in the outer 100 microns of the skin generating a very high density of free radicals. This results in a "killing field" for pathogens on the skin surface. Wavelengths from 400 nm to over 700 nm travel deeper in the skin and have been shown to alter the cell wall potential in white fat cells releasing beta carotene [24]. Longer wavelengths especially in the Near infrared (650 nm to over 2000 nm) penetrate over an inch into the body stimulating the release of ROS like nitric oxide increasing blood flow [25] resulting in an increased density of white blood cell coincident and proportional to the level of UV photons that in nature always accompany higher NIR exposure levels. The body assumes after millions of years of adaptation that it is exposed to natural sunlight and has developed natural defense mechanisms based on that assumption. NIR is also absorbed by cytochrome C in the mitochondria increasing ATP synthase levels which have been shown to accelerate wound healing [26].
The more we quantify ROS levels the more we understand their importance in our health. Simply resting under a shade tree on spring day for an hour-long nap wearing a T-shirt and shorts is generating over 1018 ROS molecules in our body from sunlight. Add to that the 1019 hydrogen peroxide molecules circulating through your lungs as previously discussed. The trick is to figure out quantitatively if the ROS are providing an advantage to the host or the pathogen.
Seasonality provides conclusive data that low-level germicides in our environment can be as effective as vaccines. But unlike vaccines, this approach can be generic for a host of infectious diseases. To be effective, fundamental changes in how buildings are designed must be mandated. Building codes and regulations must change and recognize the need for minimum ROS levels in the air we breathe, water we drink, and sunlight we absorb.
It is proposed that variations in naturally occurring ROS causes seasonality. Seasonality is proposed to be an indication that ppbv levels of naturally occurring ROS levels the air we breathe, water we drink and that are generated by our body when exposed to the Sun are sufficient to stop pandemics. Failure to realize the importance of this naturally occurring germicidal reservoir has led us to create enclosed spaces that facilitate virus spread. In addition, increased air pollution levels and the reduced number of fresh air exchanges mandated for energy savings appear to be more favorable for the pathogens than the host (us). Both germicidal and therapeutic effects are occurring both killing the virus and stimulating our immune response. Quantifying ROS levels may provide a methodology to prevent flu season from starting in the first place.