The transmission dynamics of infectious diseases is susceptible to changes governed by several factors, whose recognition is critical for the rational development of strategies for prevention and control, as well as for developing health policies. In this context, mathematical modeling can provide useful insights concerning transmission patterns and detection of parameters to mitigate disease in the population.
To didactically present the mathematical modeling of infectious diseases for health students and professionals as a tool in epidemiology.
A comprehensive literature review was conducted with articles obtained from PubMed, Web of Science, and Google Scholar databases with the term infectious diseases mathematical modeling.
There are two main types of models built with a basis on fixed or probabilistic rates that describe individuals' movement in compartments that designate stages in the natural history of the disease. In this sense, deterministic models are non-probabilistic and stochastic models are probabilistic, the first one helps in developing a prospection of possible scenarios in epidemiology, while the second is more applicable in the study of the influence of variables in the transmission dynamics.
The infectious agents are in a constant process of biological evolution, as well as the environment and human conceptions, culture, and behavior, implying a constant transformation in the epidemiological profile of infectious diseases, in which the mathematical modeling can provide support to the decision-making processes concerning epidemiology and public health.
Infectious diseases, Mathematical modeling, Epidemiology, Public health
Infectious diseases are the result of a disharmonious ecological interaction between a microbial infectious agent (bacteria, fungi, parasites, or viruses, except for prions that are infectious proteins) and a host, where the dynamics in this interaction is subjected to the modulatory influence of several factors, such as the environment, the biological properties of the pathogens and the host susceptibilities to disease, as well as the influence of behavioral, cultural, and social patterns that can enhance or mitigate the host's exposure to the disease sources and consequently its transmission in the population [1].
In this sense, the connection between the above mentioned factors is critical for a better understanding of the transmission patterns to support the development of effective strategies of control, health assistance, and policies [2]. Highlighting that some infectious diseases have the potential for treatment and eradication in most cases by antimicrobial drugs and vaccines, as well as prevention by proper hygienic-sanitary and prophylactic measures, however, they also present great unpredictability regarding their epidemiological magnitudes in the population due to the biological evolution of infectious agents against therapeutic drugs along with constant social and environmental changes intrinsic to the continuous and unstoppable process of globalization and urbanization [3-5].
In this context, the unpredictability of these diseases represents a factor that can compromise the capacity of the health systems and services to meet the needs of the population, especially considering finite and limited human and economic resources, where the mathematical modeling of the infectious diseases can contribute to the health services by allowing extrapolations of the epidemiological behavior of the infectious diseases, as well as interventions, whose effectiveness can be analyzed considering numerous factors that can influence the dynamics of disease transmission and guide the public health decision-making [6], such as the study by Hoertel, et al. [7], Which, through mathematical modeling, analyzed the effects of measures such as lockdown, physical distance, and the use of masks on the COVID-19 cumulative incidence and mortality, bed occupancy, concluding that the preventive measures mentioned would be effective in reducing the speed of the epidemic in France, but not enough to prevent the maximum occupancy of the ICU beds, still emphasizing that without such measures, the magnitude of the pandemic would be much greater in the French population, suggesting the continuity the use of masks and social detachment after periods of lockdown.
Therefore, this work didactically presents mathematical modeling as a tool useful in epidemiology, having as target students and professionals from health sciences.
This work adopted the methodology described by [8], presenting a text with an educational approach derived from the analysis of the conceptual and experimental articles raised in the PubMed, Web of Science and Google Scholar databases with the boolean operators infectious diseases 'AND' mathematical modeling. The selection criteria were pertinence to the theme and consistency of the information provided, and full availability of the material online, while the exclusion criteria were works published in events and works not fully available online.
This review brings a conceptual understanding of what is a model, which data are used in the mathematical models applied to the infectious disease dynamics, the types of models, and how they are built through a didactic text with a comprehensive approach.
In this topic, the data and the main methods used in the infectious diseases mathematical modeling are presented considering the graphic shape an epidemic can present regarding the number of infected individuals during a time interval, followed by explanations about the basic measure used to assess epidemic risks and the effectiveness of interventions according to mathematical modeling, as well as few strategies that can be adopted to increase the realism of a mathematical representation of an epidemic.
A mathematical model is an abstract representation of a phenomenon constructed with the use of equations that generate perspectives of the general behavior of an epidemic event, also representing a way to investigate the influence of determinate factors over disease spread, providing a crude general behavior of an epidemic as addressed by epidemic curves, thus allowing predictions about the endurance of an epidemic, its magnitude in the population, and the evaluation of factors that influence the transmission dynamics, and consequently the number of cases. Highlighting it is possible to apply mathematical refinements to the models to enhance their proximity to real data [9,10].
In the epidemiology of infectious diseases, mathematical modeling is a tool of great versatility, that allows the identification of patterns in epidemics, extrapolations of epidemic behaviors along with the effect of interventions such as pharmacological treatment, immunization, quarantine, social distance, and hygiene measures in a dynamic context, presenting low cost and enabling simulations of experiments condemnable ethically in human beings, as well as simulations of experiments that present low economic viability in animal models [11].
In general terms, the mathematical models applied to the epidemiology of infectious diseases can be classified into two types: 1) The deterministic models considering nonrandom rate flows in a population stratified in compartments; and 2) The stochastic models that consider probabilities in the movements between the compartments of the model, such as the probability of a susceptible individual being infected and the probability of transmitting the disease in the population addressed by a mathematical system [12].
The deterministic models of the infectious diseases represent the most practical way for the approximate analysis of how an epidemic will behave in a closed system, in which the population is divided into compartments that describe disease states, where differential equations appearing as derivatives describe the movements between these states by determining variations over time [13].
In this context, considering a total population N (equation 1) that is initially found in a compartment called susceptible (S equation 2), which after the introduction of a pathogen, gradually moves to the compartment infected (I equation 3), according to the differential equations below:
Equation 1 where
Equation 2
Equation 3
In which the negative sign preceding the infection rate β indicates that the product of S x I decreases among the individuals in compartment S, while the number of infected people grows in the same proportion [14], as seen in the SI model in Figure 1 (on the left side).
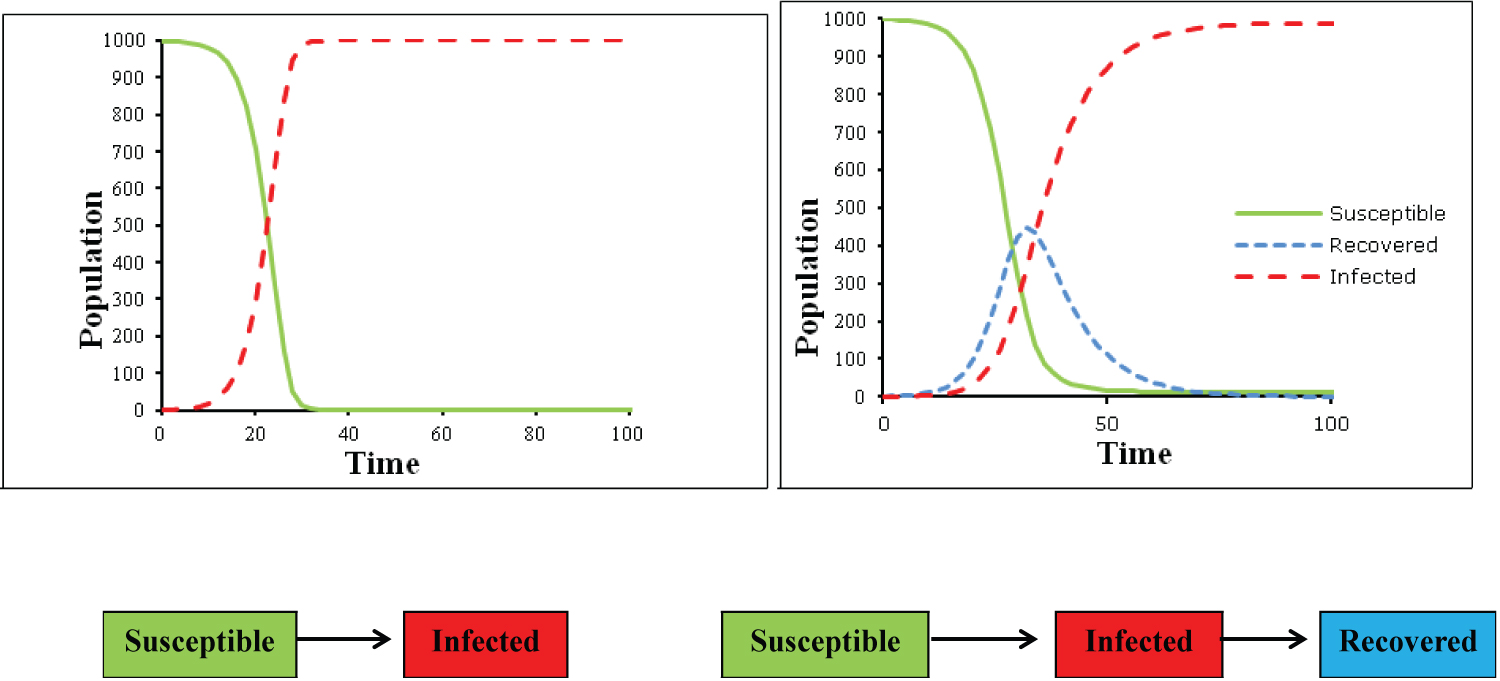 Figure 1: Graphical representation on the SI model (Susceptible and Infected) on de left and SIR model (Susceptible, Infected and Recovered) on the right, and bellow their structure and dynamics in flow charts.
View Figure 1
Figure 1: Graphical representation on the SI model (Susceptible and Infected) on de left and SIR model (Susceptible, Infected and Recovered) on the right, and bellow their structure and dynamics in flow charts.
View Figure 1
In this model, the onset of infection and the exponential growth in the number of cases are approximate to the observed in the epidemic curves, however, the model cannot represent the natural decline in the number of cases after the system reaches saturation due to the absence of susceptible individuals to support new cases [15]. In this sense, the SI model is more suitable for infectious diseases that become chronic with no recovery, such as infection by HIV [16].
In this sense, the addition of a new compartment capable of capture the decline in the epidemic curves due to acquired immunity or death brings to the system more realism, as well as applicability to self-limiting, or treatable infections. Highlighting that the new compartment, the recovered or removed (R equation 7) should increase exponentially regardless of the number of susceptible individuals, depending exclusively on the number of infected multiplied by a recovery constant Ɣ [17].
In this case, the system of equations becomes:
Equation 4
Equation 5
Equation 6
Equation 7
As a result of adding this new compartment to the model, the graphic representation becomes capable of describing the essence of the epidemiological behavior of most infectious diseases, as shown in Figure 1 (on the right side), in which the number of susceptible individuals decreases in the same proportion as the number of infected increases, and the number of recovered people increases as the number of infected people declines [14,15].
Highlighting that the deterministic models are not limited to the SI, and the SIR structures, being possible to implement different structures and dynamics in the deterministic systems, which, after refinement, attribute to the model a greater degree of realism in their epidemic representations of the infectious diseases, considering factors such as the incubation period by adding the exposed compartment (E), age stratification, and spatial structures [16-19].
In this sense, Figure 2 shows a hypothetical case considering the compartments Susceptible, Exposed, Infected, and Recovered with two dynamics in the populations of three countries, assuming the flow of individuals between different geographic spaces.
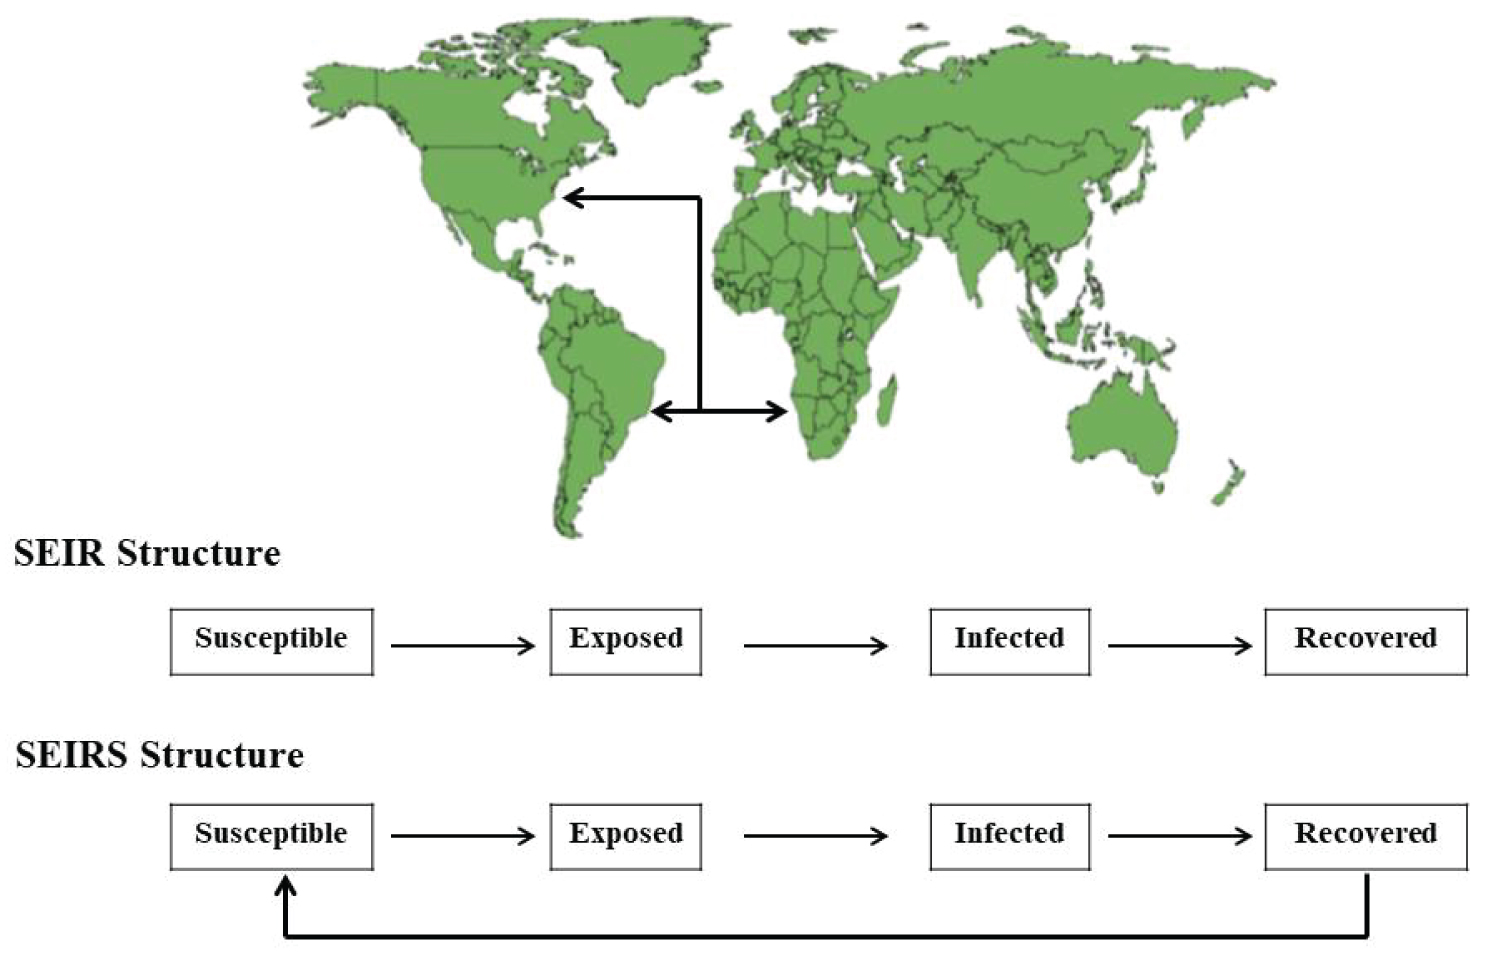 Figure 2: A hypothetical transmission dynamics considering spatial structures in two models with similar structure, including the compartments susceptible, exposed, infected, and recovered in Angola, Brazil, and United States, assuming the flow of people from these countries in different compartments with two distinct dynamic, where the SIER model assumes total recovery or removal of the system due to immunological memory or death, and the SEIRS assumes that the recovered individuals are capable of being infected again.
View Figure 2
Figure 2: A hypothetical transmission dynamics considering spatial structures in two models with similar structure, including the compartments susceptible, exposed, infected, and recovered in Angola, Brazil, and United States, assuming the flow of people from these countries in different compartments with two distinct dynamic, where the SIER model assumes total recovery or removal of the system due to immunological memory or death, and the SEIRS assumes that the recovered individuals are capable of being infected again.
View Figure 2
However, although the deterministic models capture the epidemiological behavior essence of the infectious diseases, it does not consider numerous events of random nature that can influence the transmission dynamics, such as environmental factors, and protective behaviors in the susceptible host population through prophylactic measures, rapid and effective responses of the health systems, and the participation of asymptomatic individuals in the transmission dynamics, being the deterministic models the most suitable to simplify the epidemiological behavior of a given infectious disease in a worst-case scenario, but not the most suitable for making decisions in real-time [20].
Exemplifying the employability of deterministic mathematical models, Ngeleja, et al. [21] developed a model to assess the role and magnitude of the involvement of human populations, rodents, fleas, and the survival of pathogens in the environment on the spread of bubonic plague, an infectious disease caused by the bacterium Yersinia pestis, which represents a serious public health problem for some African countries, such as Tanzania.
The model by Ngeleja, et al. [21] adopted the susceptible (S), exposed (E), infected (I), and recovered (R) structure and dynamics in the human population, assuming a return to the susceptibility and reinfection stage; in the flea population a susceptible (S) and Infected (I) structure and dynamics were used since once infected by the pathogen Yersinia pestis, the fleas do not recover from the infection; for the rodent population, the susceptible (S), exposed (E), and infected (I) structure and dynamics were assumed, considering natural death, and interaction/contact between humans, fleas, rodents, and the environment, according to the differential equations below:
Human population (SEIR)
Equation 8
Equation 9
Equation 10
Equation 11
Rodent population (SEI)
Equation 12
Equation 13
Equation 14
Flea (SI)
Equation 15
Equation 16
Where ψ2s < ψ2i
Pathogens in the environment
Equation 17
Where the following parameters are added to the differential equations: Γfr, Γfh, Γrf, Γhf are parameters related to the adequate contact rate between flea to rodent, flea to human, rodent to flea, and human to flea; ω1 is the adequate contact rate between pathogens to human, and ω2 is the adequate contact rate between pathogen to rodent ; α1, α2 and α3 represent progressions rates, respectively, susceptible human to exposed, exposed human to infected, and infected to recovery, and ϖ is the progression rate from recovered human to susceptible ; Ɣ1 represent the progression rates of susceptible rodents to exposed, and Ɣ2 the progression rate of exposed rodent to infected; µ1, µ2, µ3 and µ4 are in order, the natural death for human, flea, rodent and pathogen, δ1, δ2 and δ3 are the disease induced rates for human, flea and rodent; ψ1, ψ2s, ψ2i, and ψ3 are respectively the imigrations rate of human, susceptible flea, infected flea, and rodent; π1, π2, π3 are the proportional migrantion that are susceptible, exposed, and recovered; κ1, κ2 and κ3 are the proportional rodent migrants that are susceptible, exposed and infected; and β is the rate that fleas become infected. Highlighting these parameters were from the literature.
In the numerical solution presented by Ngeleja, et al. [21], In the absence of interventions, the parameter that has the greatest effect on the dynamics of transmission to humans and rodents is the β infectivity rate in the flea population, suggesting that the most effective strategies should focus on vector control, with the infected populations of humans and rodents being negligible parameters, as well as the environment in the transmission dynamics. This result is similar to those from Mbogo, et al. [22], that developed a comparative analysis of deterministic and stochastic models with the structural dynamics susceptible and infected (SI) for human and vector populations, also observing the relevance of strategies with a focus on vector control to mitigate malaria transmission, however differently, the environment was a parameter with some degree of significance in the malaria transmission to humans.
The stochastic mathematical models of infectious diseases represent a more realistic approach to epidemics, because they allow the recognition of the initial patterns in an epidemic the analysis of the spatial distribution of case numbers in a given location, and allow estimations about the duration of an epidemic, considering differences among individuals in the population, such as age, sex, as well as social and geographic aspects that impose non-uniformity in the contact between individuals, in addition to environmental factors such as seasonality and transmission pathways [23-25].
These models tend to have complex and sophisticated mathematical formulations, and can be classified into three types: 1) Stochastic differential equations; 2) Markov chains with continuous-time or 3) Markov chains with discrete-time. All the stochastic models assume probabilities in the transition between the compartments of the system, also assuming the presence of a state free of disease, which is different from the deterministic models that assume an equilibrium state, which does not represent the end of an epidemic. In addition, they have great employability in asymptotic analysis, where the main objective is to describe the behavior limits considering the number of infected individuals in a large population [23].
The models of the type Markov chain assume that each infection will occur independently of the past one in a probabilistic fashion, being possible to obtain from these models predictions about the stochastic risk of a major or a minor outbreak to occur when the number of infectious individuals is too small in a population of susceptible hosts [26], and the stochastic differential equations consider special probability and diffusion coefficients in the structures defined by the deterministic models considering random processes in the movement of compartments that compose the model [27].
The stochastic models represent a more realistic approach to model infectious diseases because they contemplate the high degree of uncertainty in the dynamics of transmission, providing a range of possible outcomes of an outbreak considering a large number of variables that influence the epidemic behavior of an infectious disease, however, they tend to be limited regarding the degree of complexity in the formulation of the mathematical system and data interpretation through different methods, such as the use of master equations [28], itô calculations [29], as well as other mathematical and statistical approaches based on brownian motion [30], or markov processes that add stochasticity to differential equations [31], monte carlo method [32], the [33] gillespie's first reaction method, among other methods.
In this sense, as an example of stochastic model development and implications, Legrand, et al. [34] evaluated the transmission of ebola hemorrhagic fever in the community, hospitals, and due to traditional burial ceremonies using real epidemiological data from epidemics in the Democratic Republic of Conga, and Uganda, respectively in 1995 and 2000. Their model was composed of the compartments susceptible (S), exposed and not infectious individuals in the community (E), Infected and infectious (I), hospitalized individuals (H), dead individuals that remain infectious during traditional funerals (F), and removed individuals by cure or death, as seen in equations 18-23, assuming that all cases were due to human to human transmission, except the first case
Equation 18
Equation 19
Equation 20
Equation 21
Equation 22
Equation 23
The model presents the following parameters: βI, BH, and BF are coefficients of transmission, respectively, in the community, at the hospital, and during funerals; θ1 is the percentage of infected cases that are hospitalized; δ1 and δ2 are the case-fatality ratios; α is the inverse of the mean duration of the incubation period; Ɣh-1 is the symptom onset to hospitalization; Ɣdh-1 is the mean duration from hospitalization to death; Ɣih-1 is the mean duration from hospitalization to the end of infectiousness for survivors; and Ɣf-1 is the mean duration from death to burial. Highlighting the model's parameter were evaluated using the maximum-likelihood adopting 95% of confidence interval, then sets of parameters generated by latin hypercube sampling were computed assuming twice the difference of log-likelihood values that was X2 distributed with degrees of freedom with values equal to the number of estimated parameters, then 700 simulations were run by the gillespie's first reaction method, and in each simulation, the partial rank correlation coefficient was computed to analyze the influence of each parameter in the epidemic size.
In this model, Legrand, et al. [34] found out the community transmission was a significant source of infection in Uganda, while the traditional burial ceremonies played a more important role in the transmission dynamics in the Democratic Republic of Congo, emphasizing that appropriate hospital precautions to avoid transmission between patients and health care workers, as well as precautions with the corpses, are important to decrease the size and duration of epidemics. The authors [34] also proposed tracing contact interventions as a strategy to identify sources of infection, thus decreasing the transmissibility due to proper isolation and health care of infected and suspicious cases.
In general, both approaches exhibit the same behavior, where the deterministic models can capture the essential patterns of an epidemic; however, it cannot answer the question: what are the margins of error of the estimates for disease peaks? Therefore, to address this question, the stochastic model can be used, considering the minimum and maximum probabilistic range an epidemic can assume.
That is, the deterministic approach provides an overall insight about the disease spreading in a fast way, whereas the stochastic framework provides statistical insights into the transmission events providing a range of possible epidemic scenarios [22].
Deterministic models tend to present results that do not undergo major changes due to fluctuations in the population, but undergo significant changes if the parameters inserted in the differential equations are modified; in this context, the stochastic models are more responsive to quantitative changes both in the populations and subpopulations, as well as in the modeling parameters, making it important to emphasize that there are several ways of working probabilities in stochastic processes as addressed above, which makes these models too complex and difficult to interpret [22,30,35].
Moreover, both deterministic and stochastic models share the challenge in representing the natural history of infectious diseases, considering sources of infection, transmission routes, incubation period, infection and transmissibility periods, treatment, and development of natural immunity, which are parameters that can be implemented in mathematical systems through three ways: i) Using data already described in the literature [36], ii) Empirically through estimations with basis on epidemiological data [37,38], or iii) Estimated by computer programs using statistical methods such as root mean square error on epidemiological data [17].
In this sense, when the parameters come from the literature, they can generate results slightly different from a real epidemic because of variability concerning environmental, socio-cultural aspects, the virulence of the pathogens, and resistance-susceptibility profile among the host populations, as well as behaviors with a protective effect to the disease, which can manifest differently in time and space. While the parameters established by analysis of contact rates, incubation time, the prevalence of pathogens in the population and the environment, among other parameters, demand time and statistical treatment, making the mathematical representation more accurate for what is intended to be analyzed, however, also presenting challenges for the development of generalizations valid for other models [39,40]. Therefore, any mathematical modeling study should present calibration and validation considering statistical analyzes of real epidemiological data to assess the accuracy of the models [41].
In the epidemiology of infectious diseases, the basic reproductive number or R0 (Figure 3) represents a parameter that expresses the typical number of secondary cases produced from a single infected individual, informing the epidemic risks, in which values of R0 greater than 1 indicate a high predictive risk of an epidemic event to occur, while values of R0 smaller than 1 indicate a low risk of the occurrence of an epidemic event [42]. In this context, the R0 can be obtained from ordinary differential equations considering the relation of the rate of infection (β) by and the rate of recovery (Ɣ) [43,44], usually calculated by next-generation matrixes [21,22,29,45], by the exponential growth rate method and maximum likelihood method [17], or by bayesian statistics [46].
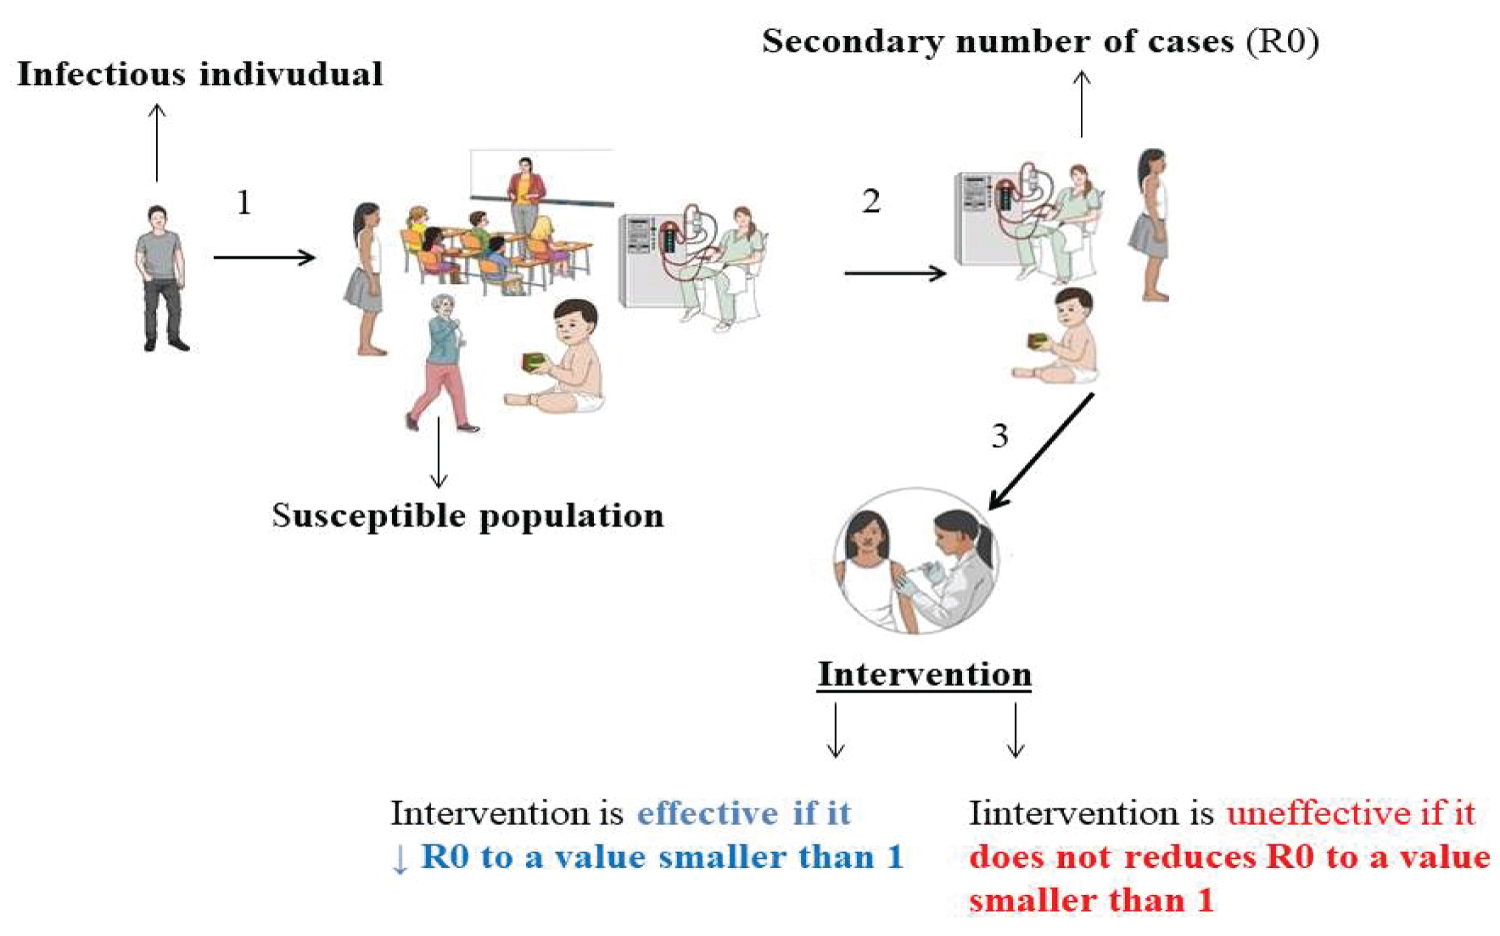 Figure 3: A schematic representation of the basic reproductive number in a dynamic social context with its interpretation over interventions; initially, an infected individual introduces an infectious agent into a heterogeneous population with individuals with different profiles of susceptibility to the infectious agent, who are likely to produce secondary cases from the primary one, in this context, if the intervention is effective, it will be able to reduce the cases secondary infections by reducing the basic reproductive number of the disease in the population.
View Figure 3
Figure 3: A schematic representation of the basic reproductive number in a dynamic social context with its interpretation over interventions; initially, an infected individual introduces an infectious agent into a heterogeneous population with individuals with different profiles of susceptibility to the infectious agent, who are likely to produce secondary cases from the primary one, in this context, if the intervention is effective, it will be able to reduce the cases secondary infections by reducing the basic reproductive number of the disease in the population.
View Figure 3
Moreover, the R0 is a parameter used to evaluate the efficacy of interventions such as quarantine, mask-wearing, vaccination, washing hands in hospital sets, among others; where if the intervention decreases the R0 to values smaller than 1, it is considered effective, and uneffective if it does not change the R0 [7,47-49].
However, it is important to point out that the value of R0 is a dynamic parameter restricted to the time and space in which a given infection is occurring or occurred [50] due to social and cultural factors that modulate the social contact rate between individuals, virulence factors from the pathogen, environmental conditions that enable the pathogen survival, treatment availability, as well as susceptibility of the pathogen to the antimicrobial drugs employed in the treatment along with other random factors present in the population [51-53].
Several factors can modulate the interaction of a pathogen with its host population, imposing a constant transformation for both organisms, and in this context, the mathematical modeling of the infectious diseases represents a precious tool for understanding transmission dynamics patterns and how factors, such as the environment, human behavior, and the microbial evolution to the antimicrobial drugs and vaccines can change the epidemiological behavior of infectious disease considering local peculiarities.
Highlighting that addressing local peculiarities is an important aspect for the success of public health policies, programs of disease prevention, and health assistance because in most cases the universal approaches do not consider the social-cultural differences, economic power, human resources, and facilities to deal with infectious diseases epidemic events. Therefore, efforts to translate biological, clinical, environmental, epidemiological, and social data into mathematics, and vice versa represent a low-cost strategy to approach health issues of high complexity in order to search for effective solutions.
This work did not receive funds from any institution.
The authors declare no conflict of interest.
Not applicable.
Not applicable.
Not applicable.
Not applicable.
Not applicable.