Novel corona virus (Covid-19) is biggest challenge for whole world. World Health Organization (WHO) mentioned this is epidemic.Data has been collected from 209 different individual situation reports of World health organization for Covid-19 in India. First compared the forecasting models on the basis minimum AIC, MAPE, MAE and then best model have been used for forecasting on the India epidemiological data to anticipate the epidemiological pattern of the prevalence. New and total deaths and occurrence of Covid-19 ARIMA and SARIMA found suitable respectively and forecasted for 1 September, 2020. Also, for total cases of corona in India prophet model used for accuracy and forecasting. Predicated values checked with past observed values, so both values are very close to each other. From the using such kind of time series models we can predict for next 15-20 days and make planning accordingly. This kind of projection helps to make planning for future.
Covid-19, India, ARIMA, SARIMA, Prophet, Forecasting
Corona viruses are a large family of viruses that cause illness ranging from the common cold to more severe diseases. Corona viruses were first discovered in the 1930s when an acute respiratory infection of domesticated chickens was shown to be caused by infectious bronchitis virus (IBV). Arthur Schalk and M.C. Hawn described in 1931 a new respiratory infection of chickens in North Dakota. The infection of new-born chicks was characterized by gasping and listlessness. Human corona viruses were discovered in the 1960s. Other human corona viruses have since been identified, including SARS-CoV in 2003, HCoV NL63 in 2004, HCoV HKU1 in 2005, MERS-CoV in 2012, and SARS-CoV-2 in 2019. There have also been a large number of animal corona viruses identified since the 1960 [1].
Covid-19 is the infectious disease caused by the most recently discovered corona virus. This new virus and disease were unknown before the outbreak began in Wuhan, China, in December 2019. The origin story of corona virus seems well fixed: In late 2019 someone at the now world-famous human seafood market in Wuhan was infected with a virus from an animal. Corona virus cases in India cross 3,239,096 as big cities reel from surge. The infections in India inched closer to 32 lakh-mark with 66,873 new cases being recorded in the last 24 hours as of August 26, 2020 8:01:28 pm [1]. Presently, India has reached 76.29% recovery rate at 26 August, 2020 [1].
India has the world's fourth-biggest outbreak of the virus that causes Covid-19 behind the United States, Brazil and Russia. Infections are expected to continue rising steadily in India. India has registered over 9.7 million cases. According to the latest worldwide statistics as of August 26, 2020, 14:47 GMT published by Johns Hopkins University, 24,090,241 cases of COVID-19 have been detected worldwide, with 824,160 deaths and 16,632,246 people have recovered. WHO declared the novel corona virus outbreak a public health emergency of international concern on January 30, 2020. On March 11, 2020 after sustained spread of the disease outside of China [1], the WHO declared the Covid-19 epidemic a pandemic. Public health measures like ones implemented in China and now around the world will hopefully blunt the spread of the virus while treatments and a vaccine are developed to stop it.
Covid-19 has no specific treatment and it spreads quickly; it is crucial to make healthcare services for future cases [2]. Machine learning and approximation algorithms have been used to solve problems in areas such as healthcare [3], industry [4], cloud computing [5,6], human activity recognition [7], and brain tumor classification [8]. Machine learning models are certainly useful to forecast future cases to take control of this global pandemic [9-11]. The ARIMA was used to forecast the spread of SARS-CoV-2 [11].
Tiwari & Rizwan have tried to use the machine learning to analyze the current situation created by Covid-19 and tells its impact in future days. They have analyzed that the case of Covid-19 in India is going to be same as in Italy or South Korea. India might be going to face its worst days in future if we look the pattern of these countries and India [12]. Shawni, et al. use machine learning approach to build up model which will help clinical doctors for verification of disease within short period of time and also the paper attempts to predict growth of the disease in near future in the world. Experimental results indicate that the combined CNN-LSTM approach outperforms well over the other model [13]. Ranjan and Rajesh used susceptible-infected-recovered (SIR) models based on available data to make short and long-term predictions on a daily basis. Based on the SIR model, it is estimated that India will enter equilibrium by the end of May 2020 [14].
We aim to develop a best model using a prediction model for India. To forecast the daily total deaths and confirmed cases and helps to make planning to fight against this Covid-19. The rest of the paper is organized as follows: Section 4 explains the material and methods, including a Covid-19 dataset, the prediction algorithm, and model accuracy metrics. Section 5 describes our results and discussion. Section 4 present conclusions and suggestions for future work.
We describe the dataset used to estimate the work, prediction algorithms, and model accuracy metrics.
The dataset used in this study includes the India total & daily confirmed, deaths cases of Covid-19, collected from the official website Our World in data [15] in the period from January 30, 2020, to August 22, 2020. It comprises 206 time-series cases from which to build our model, which we compare to other predictive models. Descriptive statistics tells the nature of data. To know the information about the data tools to summary statistics used like mean, standard error, minimum and maximum, skewness and kurtosis.
Various time series predicting models are available as ARIMA, SARIMA, GARCH, Prophet and LSTM etc. Here we are using ARIMA, SARIMA and one machine learning model Prophet.
ARIMA: Time Series analysis provides grounding in relation to forecasting. Recent literature has shown the importance of the Autoregressive Integrated Moving Average (ARIMA) models in terms of their simplicity in determining trends [16-19]. Modeling based on ARIMA proscribes three unique processes: The autoregressive (AR) is the foremost followed by differencing, and the moving-average (MA). These three processes are constant when it comes to the usage of ARIMA in the realm of univariate time series analysis.
We modelled the order of each of the three processes which cumulatively makes the ARIMA model. The first process which is the AR has an order p, takes the form AR
The variables which are considered random are depicted by the error term (). The expectation is that, shall complied with . The axiom is that, past values shall impact on . In addition, the procedure with respect to the MA takes an order q. The intuition behind this is that, errors which emanate from q shall have an impact with errors which are considered to be huge will not have an impact on . The MA (q) produces: The permutation of both AR of order p and MA of order q produces the Autoregressive Moving-Average (ARMA) model of order p and q. The ARMA Model proves robust for univariate time series modeling. Since, ARMA model is the combination of both AR and MA, AR (p) model takes into account past values of the series whereas MA (q) model considers past errors as explanatory variables (Ratnadip and Agrawal, N.d). Thus, a typical ARMA (p, q) is:
The ARMA models are used when the time series data is stationary. This usually a strong and robust opportunity for these models. However, not all time series data are stationary. As Ratnadip and Agrawal, (N.d) puts it, the existence of trends and seasonal patterns makes time series data non-stationary and therefore, ARMA models are insufficient to address the modelling process. Therefore, ARIMA models in this case prove to be efficient and robust. The introduction of differencing provides leverage for ARIMA models to be generalized to non -stationary time series. ARIMA (p, d, q). The (p, d, q) within the model for autoregressive, integrated, and moving average are integers whose expectations are greater than or equal to zero. The special case of ARIMA (p, 1, q) called the random walk model proscribes for the model to be written as:
By inference, .
The data for this paper considers descriptive analysis to allow easy and convenience forecasting and the ARIMA (p, 1, q) procedure is considered effective because of the trend of the Covid-19 data. ARIMA models are the widely utilized method for time series forecasting, showing the autocorrelations in the data. The model is to decide if the data is stationary or not. In the event that non-stationarity exists, it tends to be demonstrated by differencing it to a suitable degree of distinction.
SARIMA: Considering the qualities of seasonal fluctuation, the seasonal ARIMA (SARIMA) model was developed. The SARIMA (p, d, q) (P, D, Q)s model is created from the ARIMA model. There are seven principle parameters in the SARIMA model: The request for autoregressive (p) and seasonal autoregressive (P), the order of regular difference (d) and seasonal distinction (D), and the order for moving average (q) and seasonal moving average (Q), lastly, the length of seasonal period (s). Stationarity is an important condition in building a SARIMA model and differencing is frequently used to balance out the time series data. The principle techniques to check the stationarity of time series include the series end graph, autocorrelation function (ACF), partial autocorrelation function (PACF), the Augmented Dickey-Fuller (ADF) test [20,21].
Prophet model: Machine learning techniques for predicting algorithms are a branch of computer science that is trained from past data such as artificial neural networks, deep learning, decision trees and Bayesian networks [22,23]. The idea of algorithm is to select an appropriate training model according to the characteristics of past data and use it to predict the future observation results. We applied this method to Covid-19 prediction in India. Prophet is an open source framework of Facebook for time series prediction based on additive model which is opened up to the public in 2017 [24,25]. The nonlinear trends of Prophet are fitted with yearly, weekly and daily with holidays effects. The perfect Prophet function can't only predict the future, but also fill in missing values and detect anomalies.
In Prophet, the prediction model where, is a trend function used to analyze the non-periodic changes of time series, a periodic term, reflecting the periodic change, such as the periodicity of a week or a year. is the influence of an occasional day or days, such as a holiday. is an error term. In our research, we only consider the non-periodic changes of time series. We create an occurrence of the Prophet class and then to fit and predict methods. The input to Prophet is always a time series with two features: date dt and value x. In our study, dt is the date of day and x is the accumulated values of a country India.
The modelling errors were used to compare the fitness and prediction performance of the ARIMA, SARIMA and Prophet models. These criteria include the Akaike information criterion (AIC), Schwarz criterion (SC), Root mean square error (RMSE), Mean absolute error (MAE), Mean absolute percentage error (MAPE) and Theil inequality coefficient (Theil's U).
The study is about Covid-19 predictions of India. This virus has proven a potential threat to human life. To control this pandemic situation, this study based on future prediction on confirmed cases in the upcoming months. The forecasting has been done by using best models that are suitable to this framework. The dataset used in this study contain the number of confirmed cases, new cases, total deaths and daily deaths of India in the start pandemic days. ARIMA and SARIMA models were applied to Covid-19 new cases and new deaths, total cases and total deaths of India. The Machine learning model Prophet has been used. Firstly, the dataset has been pre processed. Then split the data set into training dataset to train the models and testing dataset (10 days). These models have been trained on date and total cases. The models have been evaluated on metrics. The proposed workflow has been shown in Figure 1. Time series plot are shown in Figure 2.
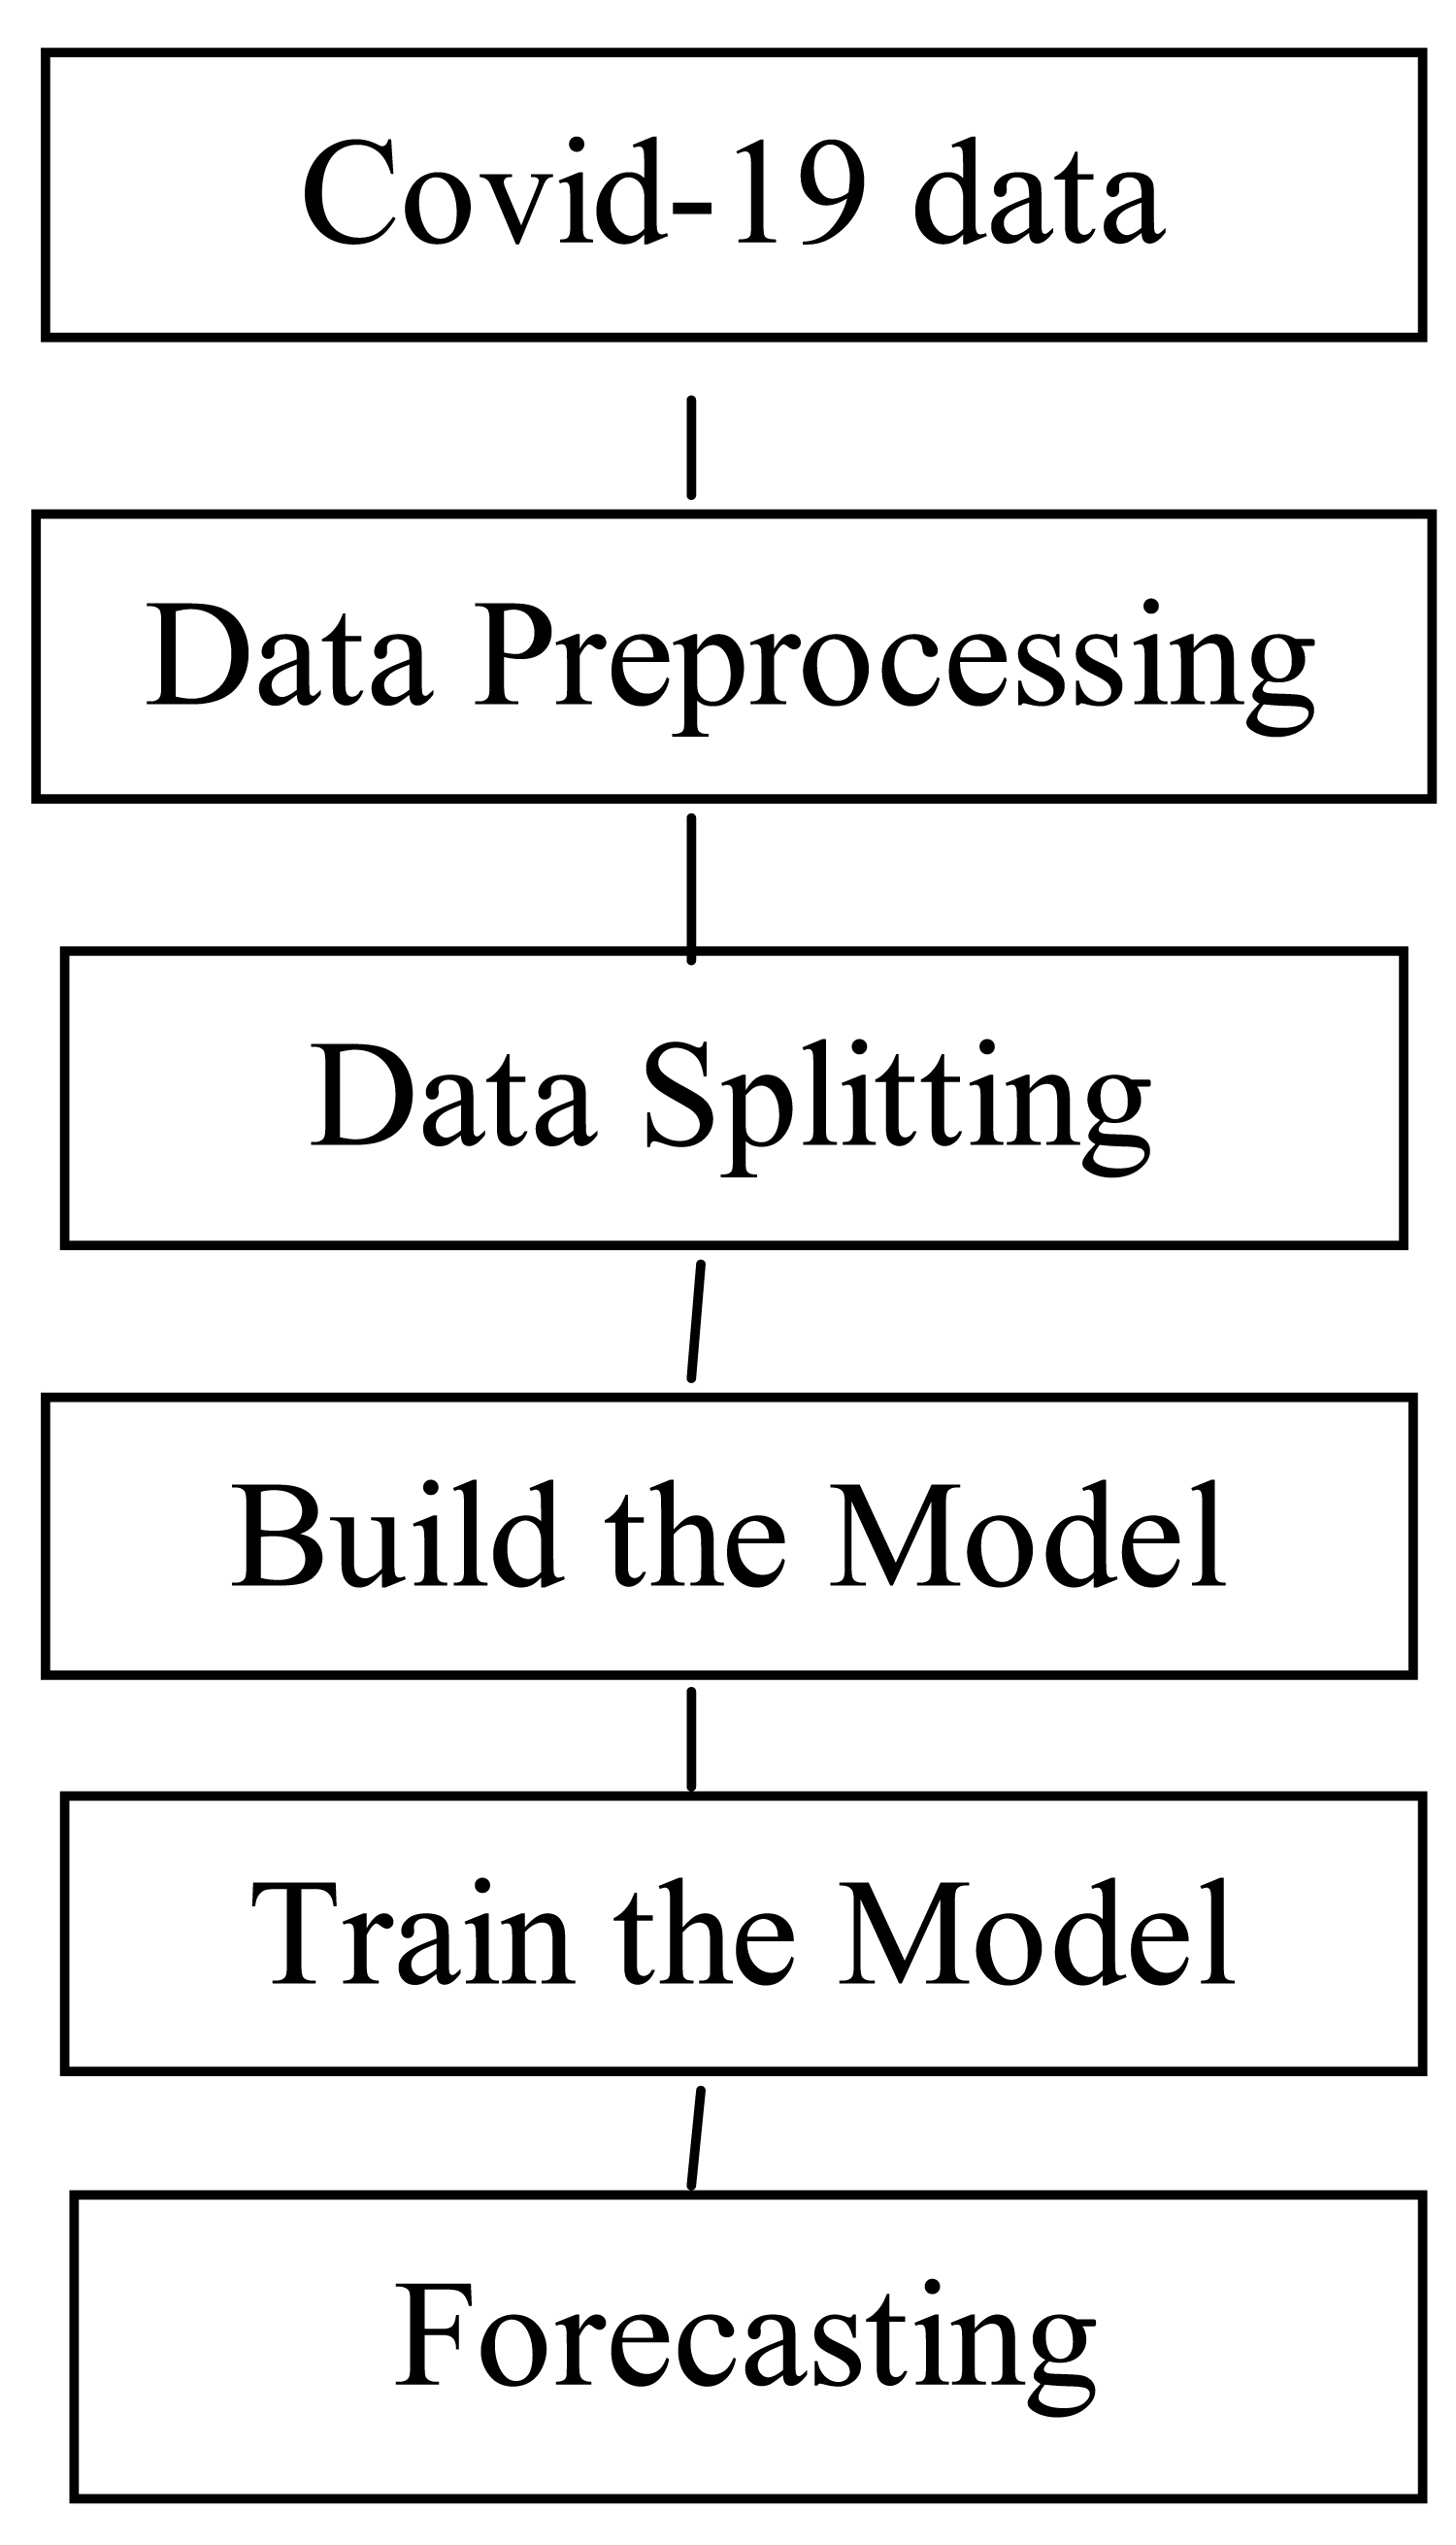 Figure 1: Proposed workflow.
View Figure 1
Figure 1: Proposed workflow.
View Figure 1
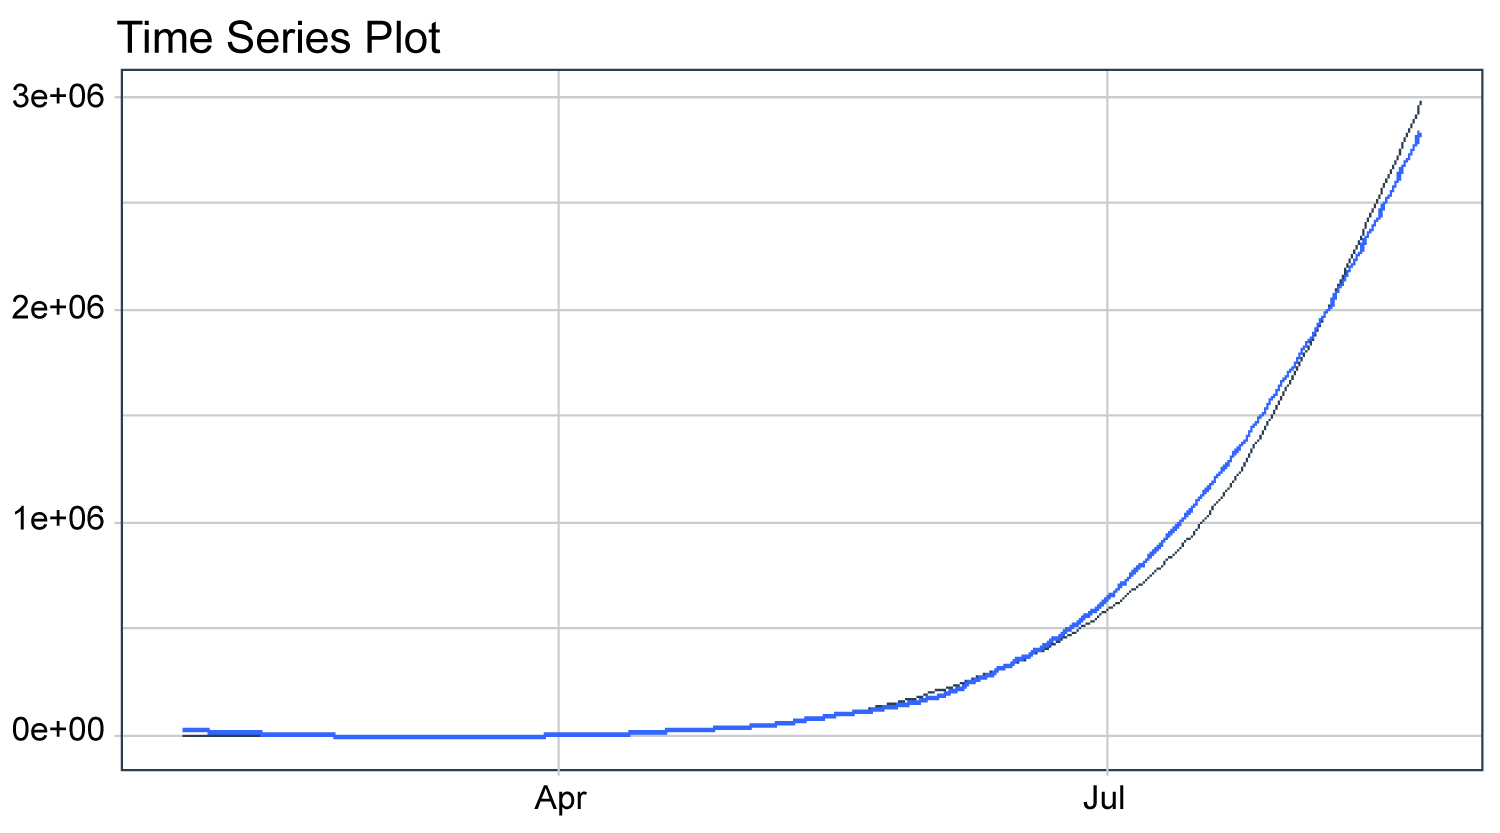 Figure 2: Time series plot of India.
View Figure 2
Figure 2: Time series plot of India.
View Figure 2
In this section, Table 1 shows the summary statistics of Covid-19 dataset of India. We find that since 30 January, 2020, to 22 August, 2020, the new cases have increased during the period from (0) to (69878). Average daily new cases are (14445). Ex.Kurtosis value is (0.63) indicates the data follows a Leptokurtic distribution which shows heavy tails on either side, which means there are outliers in the data. Followed by positive value of skewness (1.41) which indicates there is some probability of increasing in the new cases. The new deaths have increased from (0) to (2003) during the same period, with average daily new deaths about (270.84). Ex.Kurtosis value is (2.45) indicates the data follows a Leptokurtic distribution which shows heavy tails on either side, which means there are large outliers in the data. The positive value of skewness (1.45) which indicates there is some probability of increasing in the new deaths. The total cases have increased from (1) to (2975701). Average daily total cases are (46853). Ex.Kurtosis value is (2.2) indicates the data follows a Leptokurtic distribution which shows heavy tails on either side, which means there are large outliers in the data, followed by positive value of skewness (1.79) which indicates there is some probability of increasing in the total cases. The total deaths have increased from (0) to (55794) during the same period, with average daily total deaths about (10801). Ex.Kurtosis value is (0.79) indicates the data follows a Leptokurtic distribution which shows heavy tails on either side, which means there are outliers in the data. The positive value of skewness (1.40) which indicates there is some probability of increasing in the total deaths.
Table 1: Summary statistics. View Table 1
Table 2 shows ARIMA and SARIMA selecting best model forecasting for Covid-19. ARIMA model parameters were estimated by autocorrelation function ACF graph and partial autocorrelation PACF correlogram. To determine the best models for Covid-19 in India, ARIMA (5,2,10) was selected as the best ARIMA for new deaths, ARIMA (3,2,3) for total deaths. Similarly, SARIMA (8,2,5)(3,2,2) selected best model for new deaths and for total deaths, the best model to be SARIMA (3,2,3)(2,0,0). R statistical software was used to perform statistical analysis on datasets, and the significance level was set at 0.05.
Table 2: Selecting best model for forecasting. View Table 2
In Table 2, the best fitted models are based on, lowest values of AIC, SC, RMSE, MAE, MAPE and Theil's U along with highest significant coefficients. Among the particular models, these are the best fitted models. We use HP Filter for the series (New cases) and (New deaths), (Total Deaths) and Exponential moving average Filter for the series (Total Cases). The Hodrick-Prescott (HP) method was implemented to generate filtered sample datasets to obtain a smoothed-curve representation of the series, which could provide substantial advantages for the identification and construction of the ARIMA and SARIMA models. Therefore, the Hodrick-Prescott (HP) method was implemented to generate filtered sample datasets. For the series Total Deaths and the series New Deaths and the series Total Cases we found that SARIMA Model is better than ARIMA Model, considering the seasonality in theses series. After assessment of each and every trend series, we forecast the series for coming Days. For purpose of forecasting ARIMA (p, d, q) Model and SARIMA (p,d,q)(P, D,Q)s Model, as discussed in material and methods section. Data for period 30 January, 2020, to 22 August, 2020 was used for model building. As model validation data used for period 15 May, 2020 to 22 August, 2020. Best models are utilized to predict the series for the coming days. Different series are seen as fitted with various SARIMA (8,2,5) (3,2,2), SARIMA (3,2,3) (2,0,0), ARIMA (6,2,10), SARIMA (7,2,3) (1,1,1) models individually. These models are seen as best fitted models for forecasting during the period 23 August, 2020 to 1 September, 2020. Table 3 shows the model accuracy of machine learning method Prophet.
Table 3: Prophet accuracy metrics for total cases. View Table 3
In Table 4, we find that in India: The new deaths will increase from 1020 to 1103 during the period 23-8-2020 to 1-9-2020. The total Deaths will increase from 56122 to 64347 during the period 23-8-2020 to 1-9-2020. The total Cases will increase from 2704630 to 3217240 during the period 23-8-2020 to 1-9-2020. The new Cases will increase from 69296 to 75615 during the period 23-8-2020 to 1-9-2020. Figure 3 shows the pattern or total and new cases and deaths in Covid-19. Figure 4, Figure 5, Figure 6 and Figure 7 shows the forecast graph for Covid-19 new cases, total cases, total death and new deaths. Figure 8 shows the prophet model forecast plot. Figure 9 shows the correlogram of forecasting models.
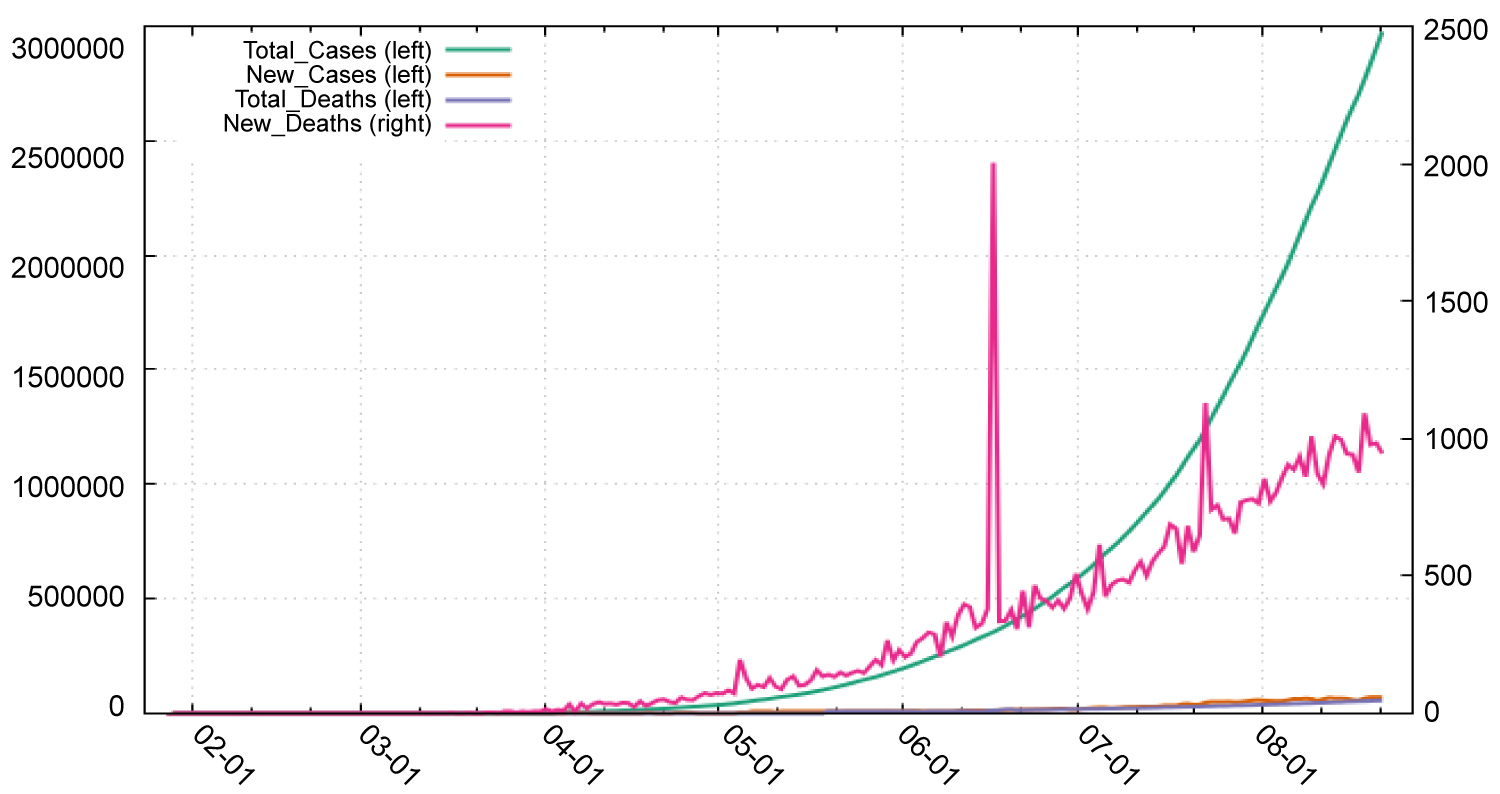 Figure 3: Pattern for total, new cases and deaths in India.
View Figure 3
Figure 3: Pattern for total, new cases and deaths in India.
View Figure 3
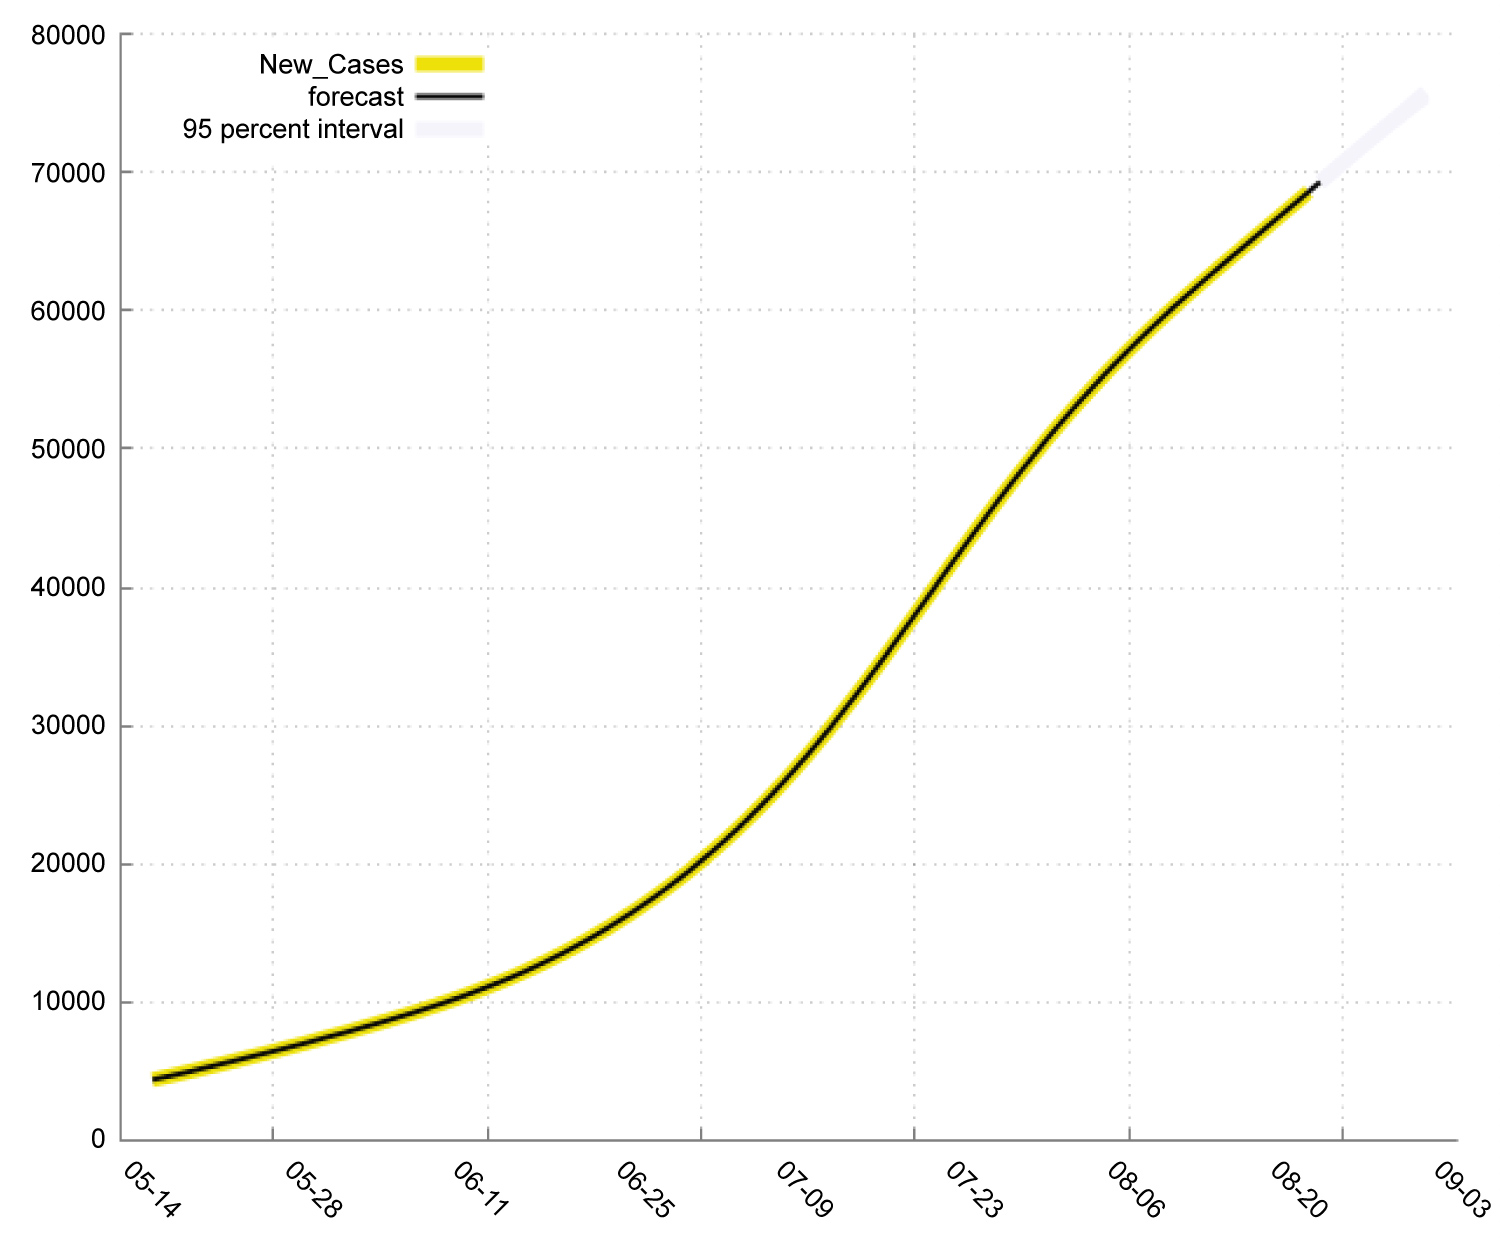 Figure 4: Forecast graph for new cases in India.
View Figure 4
Figure 4: Forecast graph for new cases in India.
View Figure 4
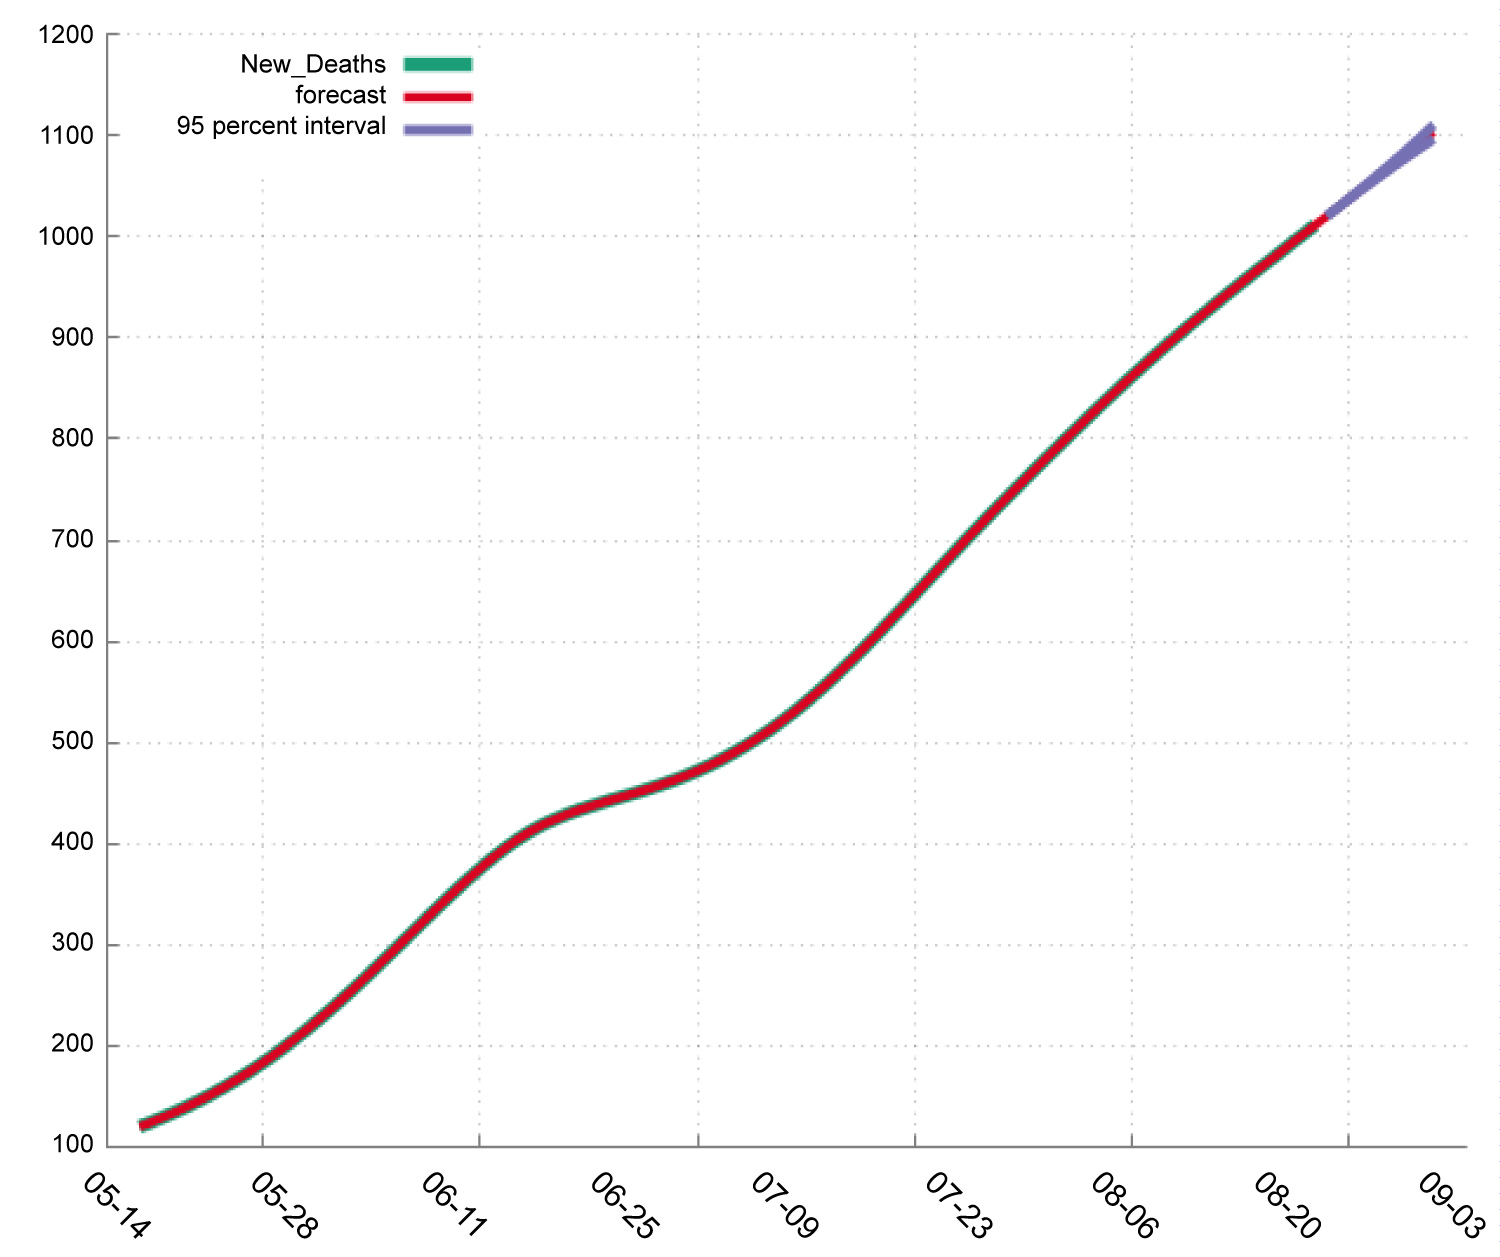 Figure 5: Forecast graph for new deaths in India.
View Figure 5
Figure 5: Forecast graph for new deaths in India.
View Figure 5
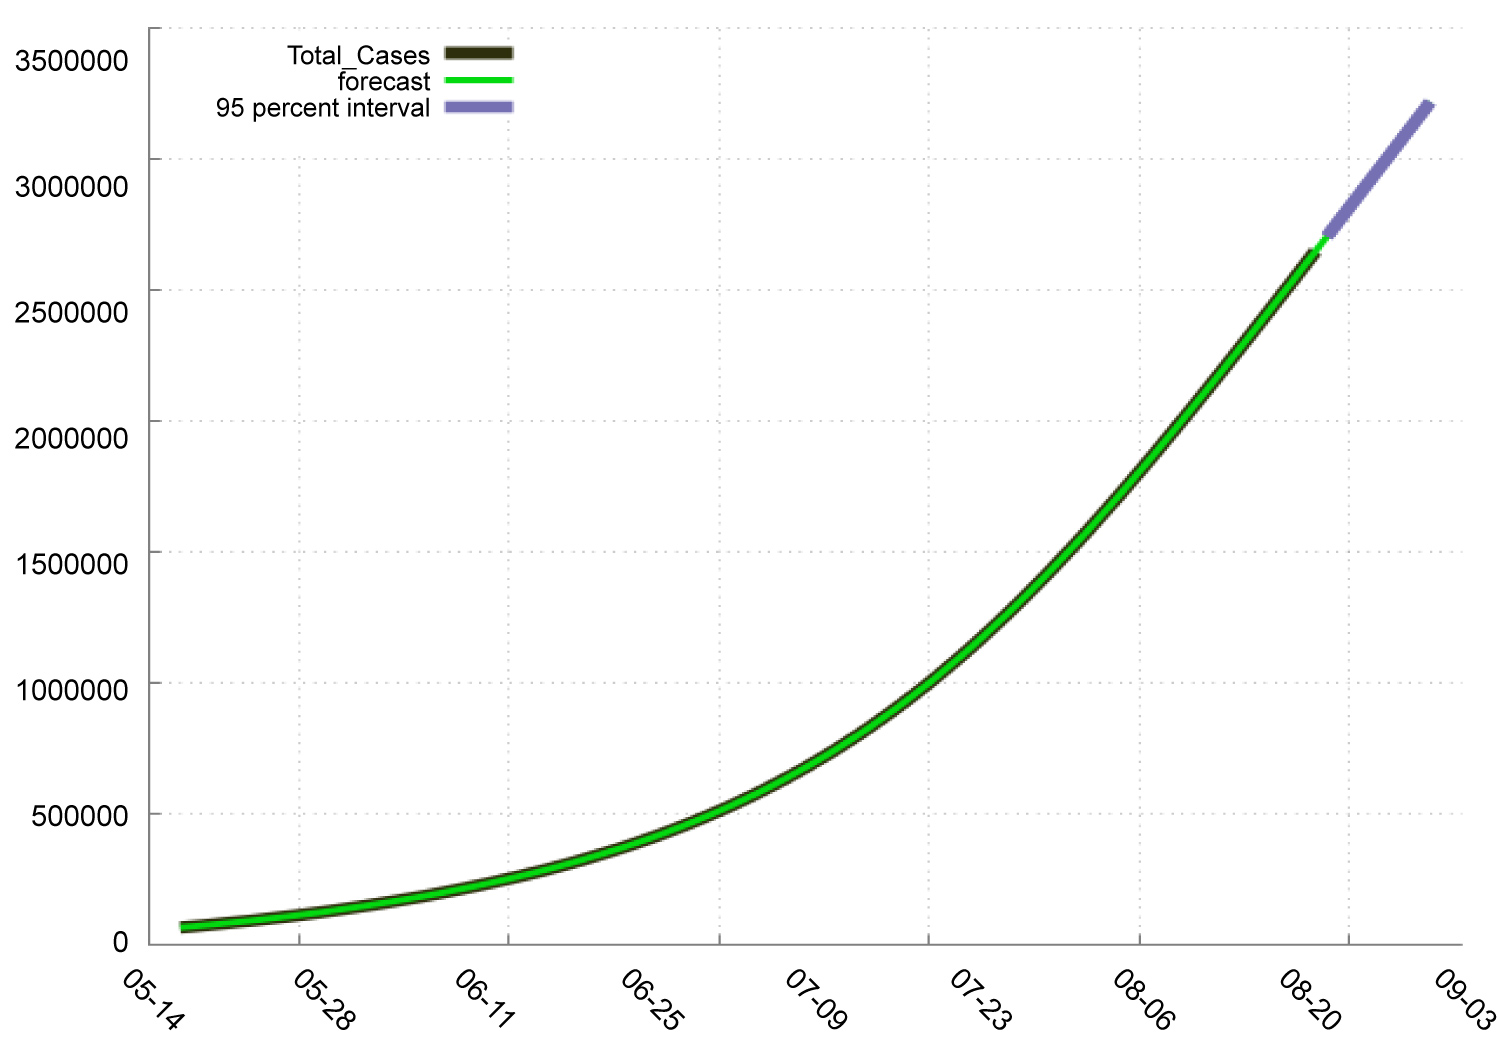 Figure 6: Forecast graph for total cases in India.
View Figure 6
Figure 6: Forecast graph for total cases in India.
View Figure 6
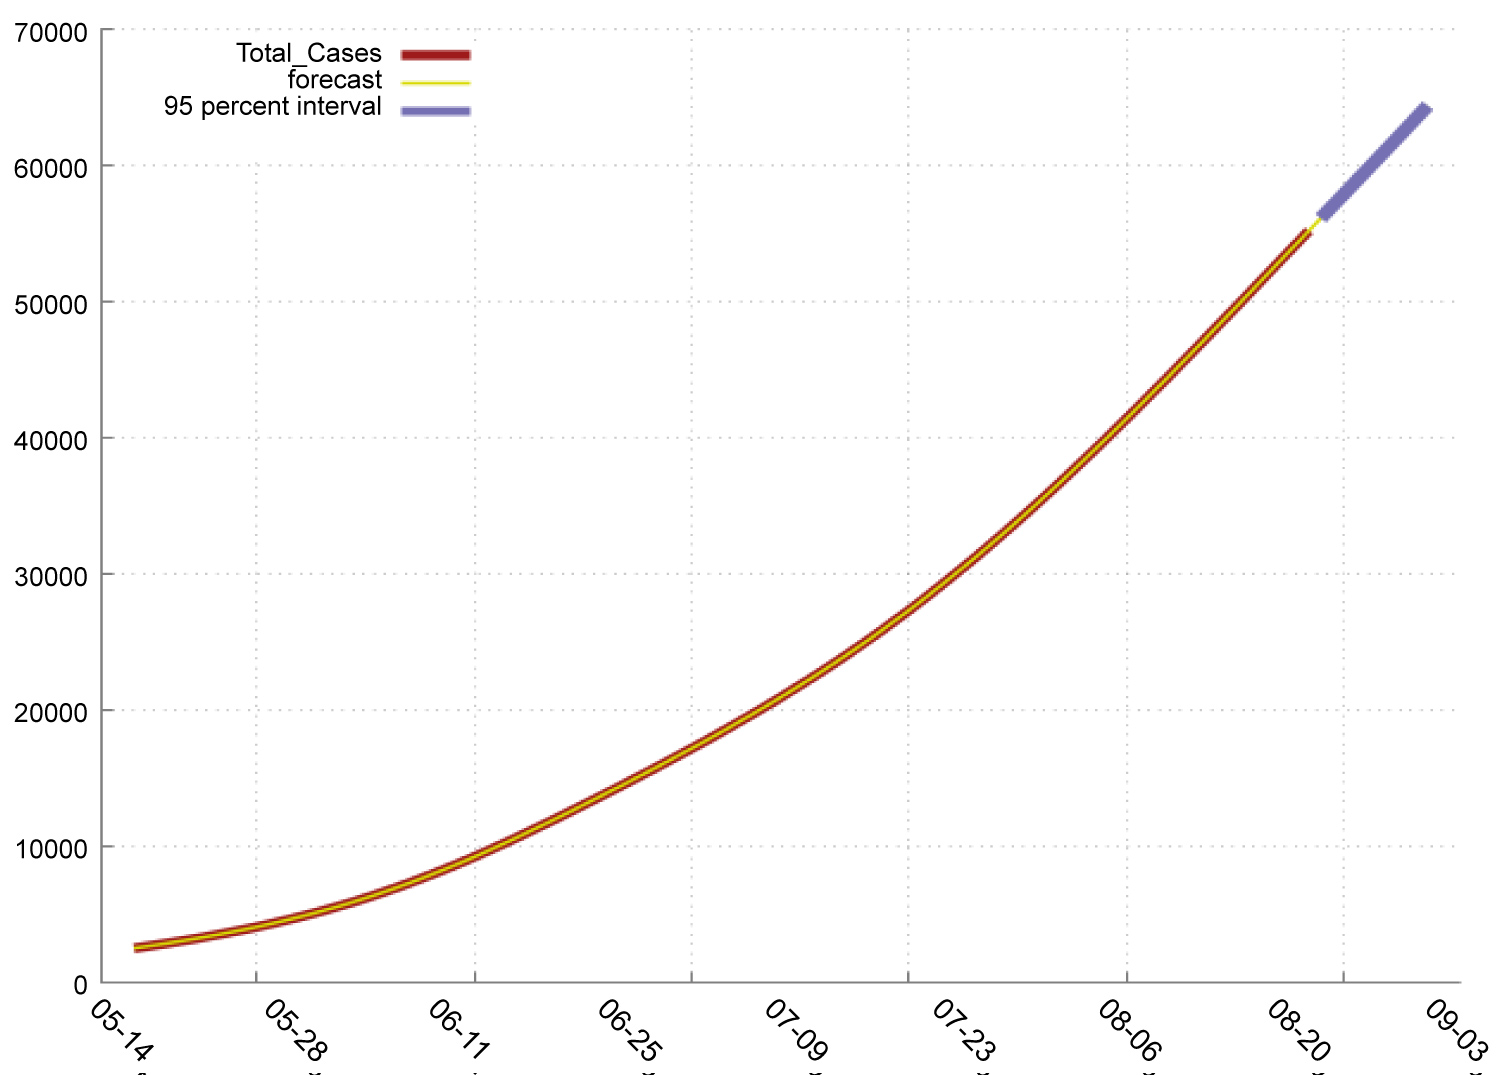 Figure 7: Forecast graph for total deaths in India.
View Figure 7
Figure 7: Forecast graph for total deaths in India.
View Figure 7
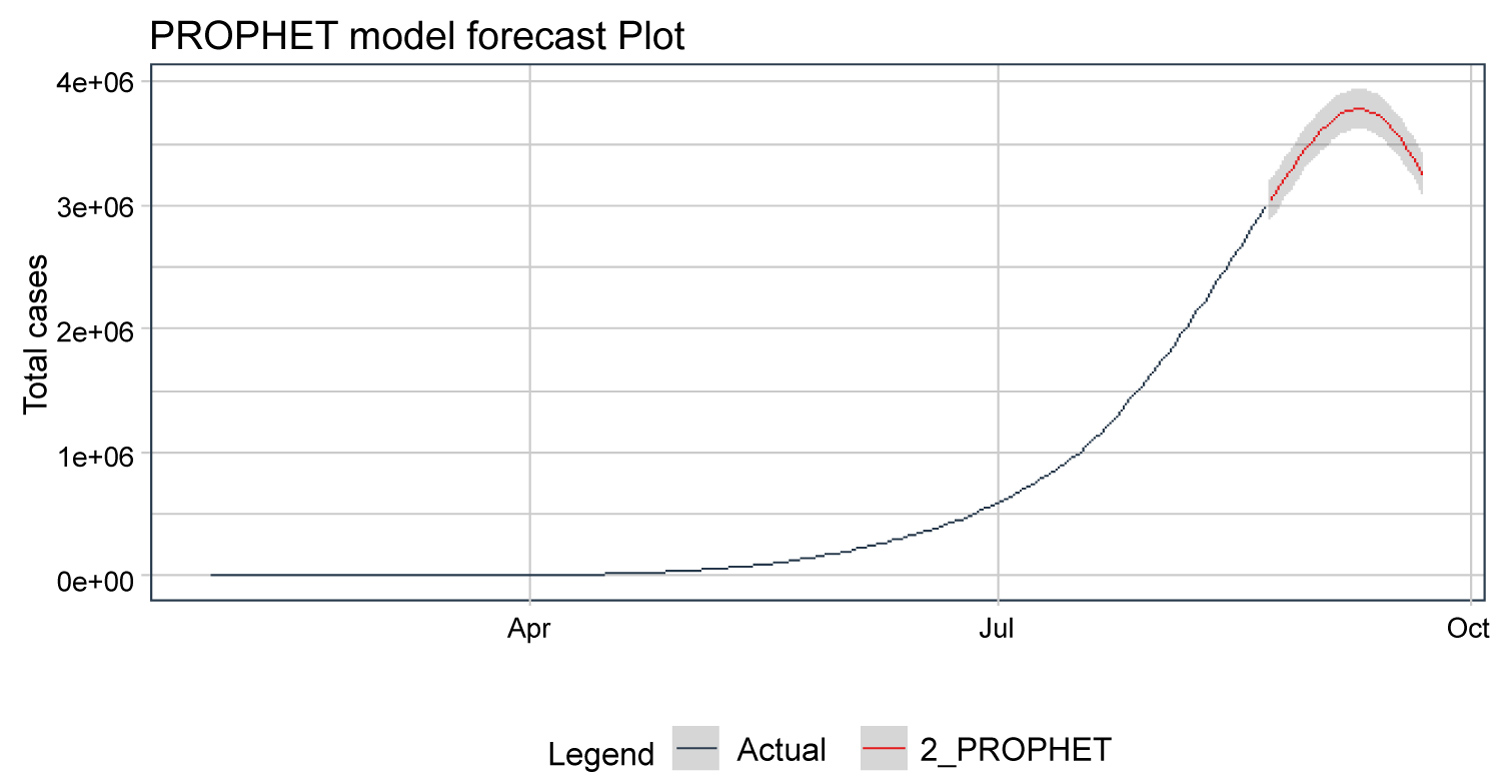 Figure 8: Prophet model forecast plot for total cases.
View Figure 8
Figure 8: Prophet model forecast plot for total cases.
View Figure 8
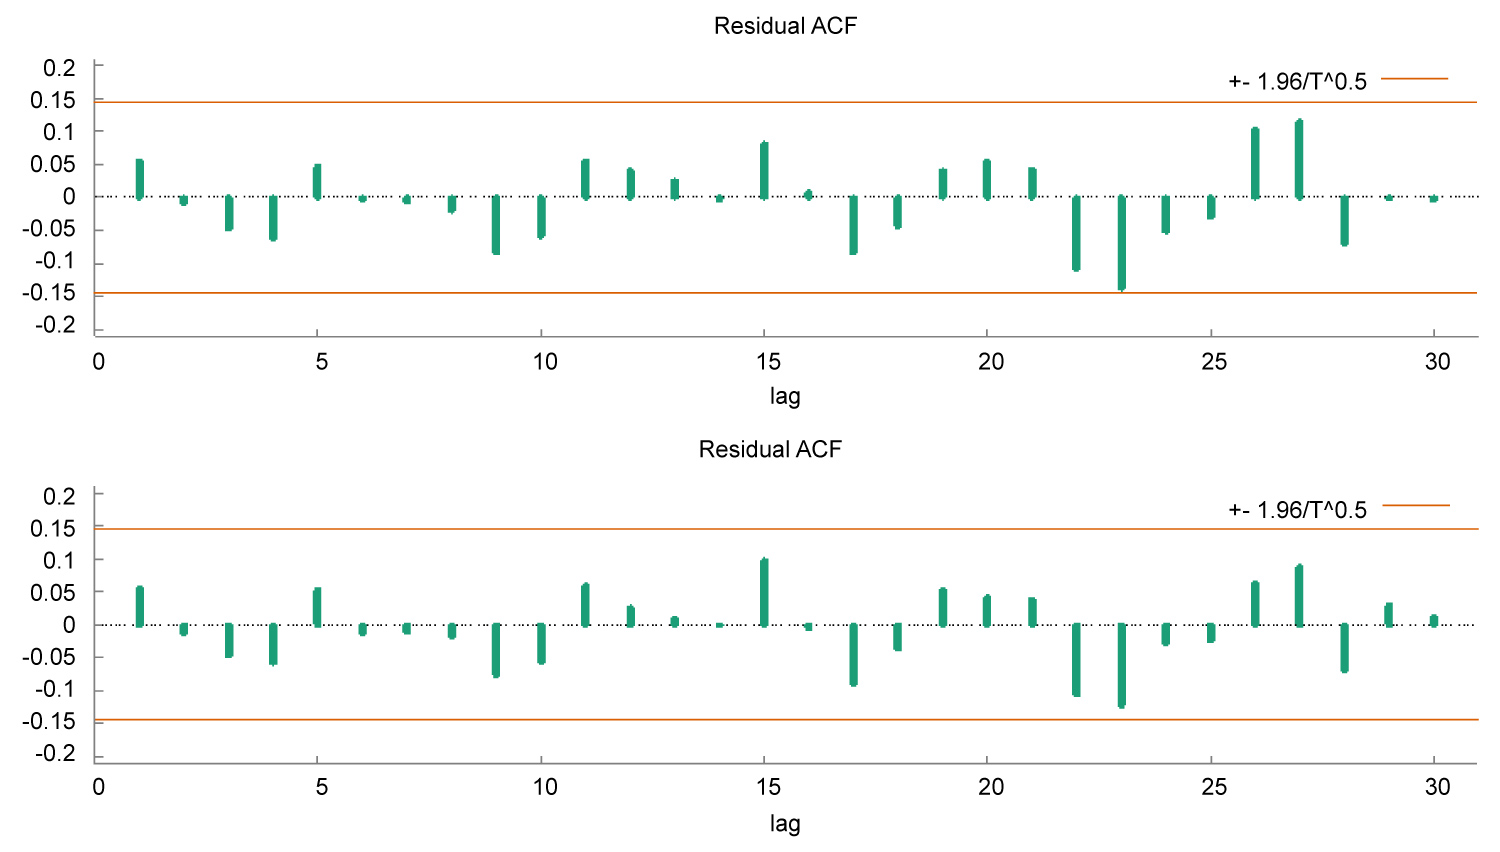 Figure 9: Correlogram and partial correlogram of the residuals.
View Figure 9
Figure 9: Correlogram and partial correlogram of the residuals.
View Figure 9
Table 4: Forecasting for new deaths, total deaths, total cases and new cases in paranthesis (standard errors) with 95% intervals. View Table 4
India is one of the high population counties in world. To stop Covid -19 is biggest challenges to county like India. But today's date (26 August, 2020); India spread of Corona viruses to extent. From the prediction times values tells that India would reach more than 32 lakhs with 64,213 deaths till 1 September 2020. Now after the all lock down, cases are increasing day by day. India has increasing day by day testing, which helps to get more information about Covid-19 spread. Also India is working on small trials on plasma therapy. India has developed aarogya setu to create more awareness about Covid-19. Due to lockdown spread to Covid-19 controlled and cases are less as compare to other countries. After the lockdown, biggest is challenge to maintain social distancing in society. But actually, medicine is required to completely stop the spread of Covid-19. This projection help government to make strategies against Covid-19.
The authors declare that they have no known competing financial interests or personal relationships which have, or could be perceived to have, influenced the work reported in this article.