Aims: To evaluate the prevalence of visual impairment among school children in Qatar, through a screening protocol based on the WHO guidelines.
Settings and design: A school-based, cross-sectional study.
Methods and material: Children of grades 1, 3, 5, 7 and 9 underwent screening for low vision during the academic year 2019-2020. Visual acuity measurement was performed by well-trained screeners using a Snellen chart at 6 meters with E symbol in which the 6/6 line was the standard for normal vision. Based upon the results of the visual acuity, data of each individual was entered in either of two screening record sheets. Children with impaired visual acuity were referred to a specialist for further assessment and evaluation.
Results: Visual acuity measurement was completed in 48,179 government school children and 51,482 private school children. The rates of abnormal visual acuity among children in private schools (21.34%) were higher than that of government schools (12.24%). More than80% of low vision children have not been diagnosed previously or were not wearing the spectacles during the measurement.
Conclusions: Out of 99,661 children, 16,882 (16.94%) were unable to read the smallest letters at six meters, although this screening program has detected the condition of abnormal vision in children, still there is a necessity to determine the possible causes of low vision.
School children, Visual acuity screening, Vision impairment
School health programs have widely adopted vision screening initiative in many countries; according to the World Health Organization (WHO), almost 18.9 million children under 15 years of age are visually impaired globally [1]. There are more than 12 million school going children (5-15 years of age) who are visually impaired due to uncorrected refractive errors [2,3]. Data on prevalence shows myopia to be the commonest cause of visual impairment in this age group, more particularly among children of Asian origin [4]. Qatar Ministry of Public Health (MOPH) conducts an annual vision screening survey in collaboration with the Ministry of Education and Higher Education (MEHE) and Primary Health Care Corporation (PHCC), that aims to detect the magnitude of visual impairment in targeted children (grades 1, 3, 5, 7 and 9) who enroll in government and private schools. This annual survey was implemented based on WHO recommendations; it draws the attention to the low vision and lazy eye conditions in school-age children and aims to early detect such conditions to improve their academic performance and learning ability [5]. Vision screeners (usually school nurses) measured visual acuity (VA) and then referred the low vision children to health centers for further eye examination and informed their parents. The team of blindness prevention program (BPP) at MOPH, coordinates the school vision screening process and conducts periodically workshops to train vision screeners in how to measure visual acuity and to deal with common eye diseases or trauma.
A standard annual vision-screening protocol was administered in the government and private schools, children of grades 1, 3, 5, 7 and 9, underwent vision screening process during the academic year 2019-2020.Kindergarten pupils and secondary grades (10,11 and 12) have been excluded. On Sep 2019, an updated list with details of targeted schools was obtained from the school affair department at MEHE, in addition, MEHE sent an official memorandum imposing obligations of screening. To make the vision screening process ready, newly joining or inexperienced ones have attended two training workshops on Nov 2019 & Jan 2020. By the end of workshops, they were able to measure VA, to fill screening forms and to identify the commonest eye diseases in childhood. All parents have read and signed an informed consent before vision measurement. Specifically, vision screeners measured the VA, recorded data and sent the filled screening forms (during Oct 2019 - Feb 2020). Distance visual acuity of both eyes was measured using a Snellen chart at 6 meters with E symbol in which the 6/6 line is the standard for normal vision. A child is considered to have low vision when VA is equal to or less than 6/9, in either or both eyes. According to the WHO classification, low vision is classified into three categories: mild, moderate, and severe. Mild visual impairment is visual acuity of ≥ 6/18, moderate visual impairment is less than 6/18 but equal or better than 6/60, severe visual impairment is < 6/60 [6]. Prior to screening, children received an explanation and a demonstration of the vision screening process. Parents were notified of the screening results and children with low vision were referred to ophthalmologists for further evaluation and treatment. The screeners registered data in two types of screening record sheets which are: Form A (Figure 1) and Form B (Figure 2). Form A concerned children failed to read the 6/6 line, including those wore medical spectacles or lenses, but their VA was not corrected to reach 6/6. Form A contained vision measurement results, and further information regarding children name, age, sex, nationality, and grade levels. Contrarily, Form B collected data from normal vision children with or without spectacles. Data collected by form B described the total number of children mentioning no personal identifiers of each child. After completion of the vision screening for all targeted children, the screeners sent (through email) the completed forms, and then data should be documented in health record. Subsequently, during March - May 2020, the author entered the data, analyzed it, and wrote this report. Data was analyzed using Microsoft Excel.
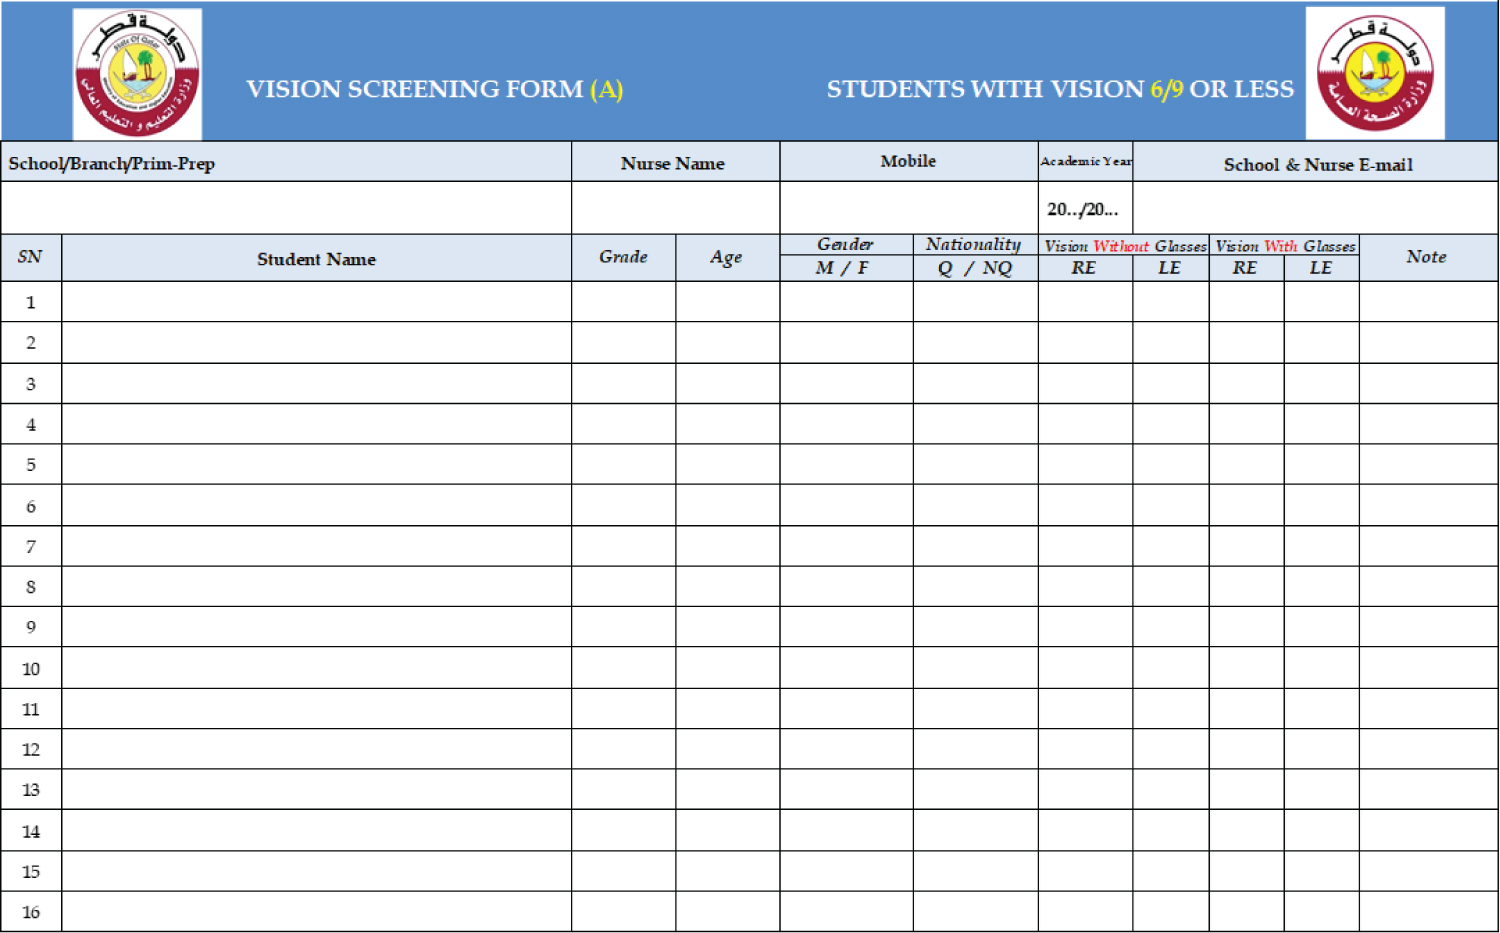 Figure 1: Vision screening Form (A).
View Figure 1
Figure 1: Vision screening Form (A).
View Figure 1
 Figure 2: Vision screening Form (B). View Figure 2
In the academic year 2018-2019, a nationwide survey was conducted among a sample of 99,661 children who received the vision screening for the academic year 2019-2020. All government schools successfully submitted the screening forms, while the overall response rate of private schools was circa 80% (160 schools out of 201 schools), which is lower than government (100%) and year 2017-2018 (85%). Reasons for non-submission of private schools are: 1) Closure of schools during the COVID-19 lockdown period (March-May 2020), 2) Shortage of nurses with delayed of employment process and 3) Turnover of nurses throughout the year. Out of the total children, 16,882 children (16.94%) had VA 6/9or below (Table 1), rates of low vision children in government and private school who had no spectacles, were 86% and 76% respectively. On the other aspect, low vision rate (21.34%) among children attended private schools was higher than government schools (12.24%) which is probably related to a high proportion of private school children were Asiatic (Filipinos and Indian), who have a higher prevalence of refractive errors. For more details, see Table 2, Table 3, Figure 3, Figure 4 and Figure 5.
 Figure 3: Distribution of abnormal vision by gender, nationality and grade.
View Figure 3
Figure 3: Distribution of abnormal vision by gender, nationality and grade.
View Figure 3
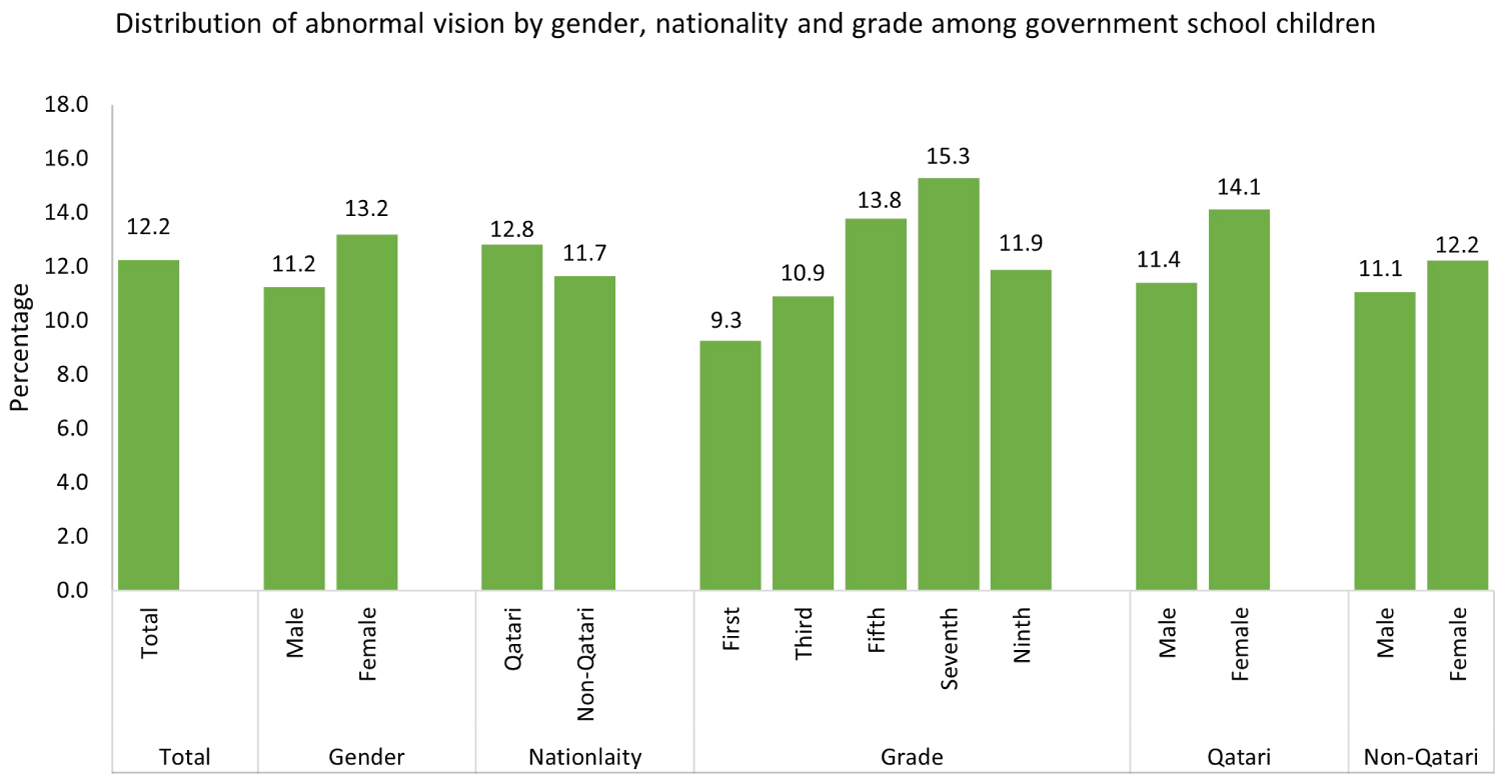 Figure 4: Distribution of abnormal vision by gender, nationality and grade among government school children.
View Figure 4
Figure 4: Distribution of abnormal vision by gender, nationality and grade among government school children.
View Figure 4
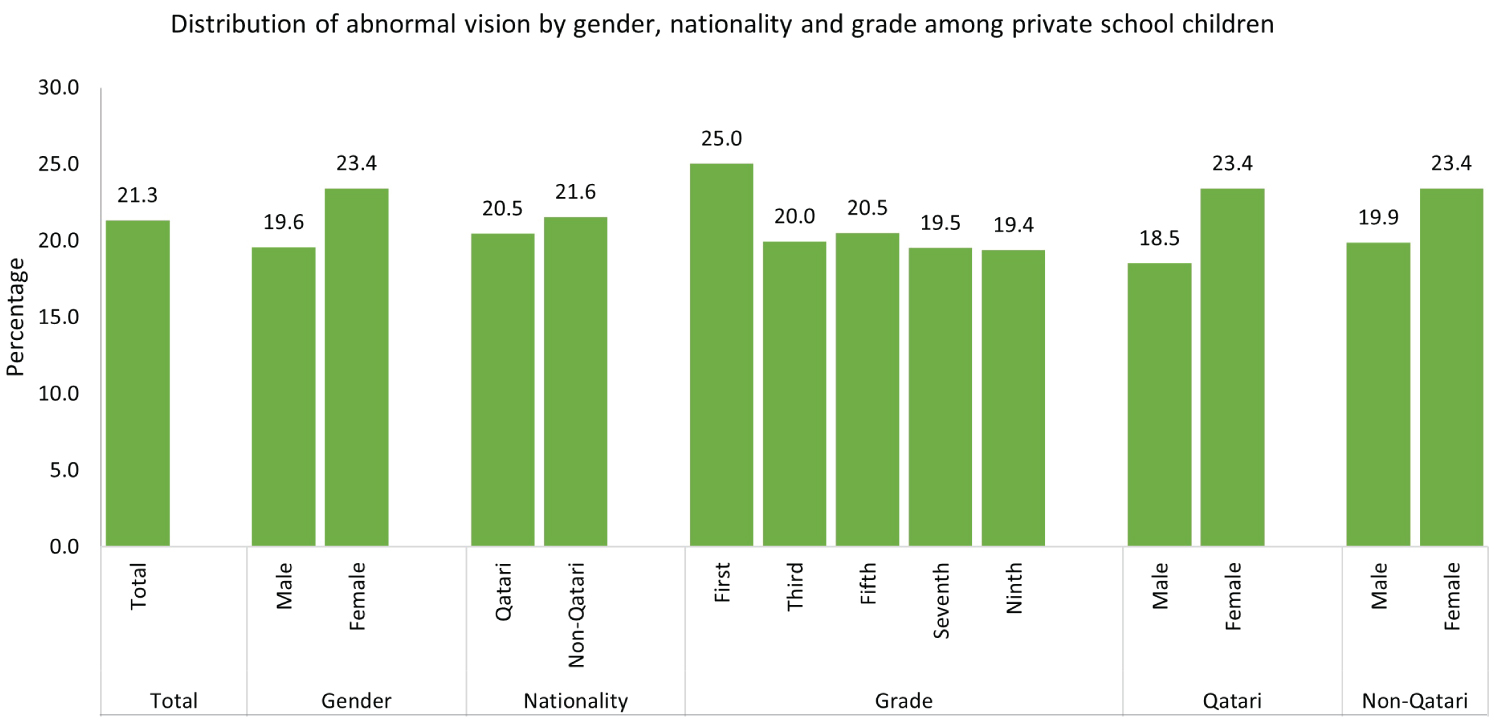 Figure 5: Distribution of abnormal vision by gender, nationality and grade among private school children.
View Figure 5
Figure 5: Distribution of abnormal vision by gender, nationality and grade among private school children.
View Figure 5
Table 1: Total Frequency and percentage of variables according to vision measurement. View Table 1
Table 2: Frequency and percentage of variables according to vision measurement - Government schools. View Table 2
Table 3: Frequency and percentage of variables according to vision measurement - Private schools. View Table 3
The rates of abnormal visual acuity during the academic year 2019-2020 in government and private schools were 12.24% and 21.34% respectively. The school vision screening program has a significant benefit in detection of obscure visual abnormalities which interfere with daily living activities of children and hinder their academic success and learning achievements. It is highly recommended to conduct a further study in selected schools to re-estimate the prevalence of low vision and to determine the most-favorable types of refractive errors among children.
The author would like to thank our partners for their support in implementation of school screening program, we are grateful to our colleagues in PHCC, government school nurses, and supervisors. We are grateful to all nurses and health professionals at private schools for their major contributions throughout the screening process. We also convey our thanks to school affair departments in the ministry of education and higher education for their coordination in involving the private schools in this screening.
Ministry of Public Health, State of Qatar, Doha.
Manuscript has been read and approved by the author who have no conflict of interest.