In the fuzzy regression models that are fitted by using fuzzy logic, every regression coefficient should be estimated at a certain level of a fuzziness tolerance because of dividing the error value into the coefficient. This study aims to compute the coefficient and deviation values of classical least squares (OLS) and fuzzy interval regression models on a sample data set and interpret them comparatively.
There were totally 514 patients with OSAS (Obstructive Sleep Apnea Syndrome) who admitted to sleep outpatient clinics. The classical and interval regression models were established for 35 positional and non-positional patients who were selected randomly. It was suggested to use an h = 0.0 value called as "turbidity tolerance level", and the mean squared error (MSE) and the coefficient of determination (R2) indexes were utilized as the goodness of fit test criteria showing the compatibility between the values calculated at the suggested h-level.
According to the classical regression model with forward selection, R2 values for dependent variable AHI (Apnea-Hypopnea Index) were calculated as = 0.679 and = 0.719, and the only independent variable ODI (oxygen desaturation index) was significant in both models. The turbidity (fuzziness) tolerance level of the model was calculated as h = 0.36 greater than h = 0.0. The fuzziness level of the interval regression models were calculated as 773.95 and 1129.54 respectively subject to 16 iterations and 70 constraints. R2 values (0.98 and 0.91 respectively) were calculated as higher obtaining the predicted values, and MSE values were found as lower (11.08 and 5.94 respectively) than OLS models. For positional OSAS patients ODI, REM and AH-duration had more significant effect on AHI whereas BMI, ODI and AROUSAL variables were strongly significant for non-positional OSAS patients.
It was shown that the independent variables Body Mass Index, Rapid Eye Movement, Oxygen Desaturation Index, Arousal (Sleep Stimulation) and Apnea-hypopnea duration had significant effect on AHI since their dispersions were very low in the interval regression models. It can be concluded that the results of the interval regression model were compatible with this dataset, and gave more accurate results.
Fuzzy logic, Interval regression, Least square estimation, Apnea-Hypopnea index, Maximum dispersion
Regression analysis is the statistical method that defines the causal relationship between a dependent variable and one or more independent variables, and are used to make relevant predictions [1]. The types and structures of dependent and independent data sets in the healthcare area (such as diagnosis, treatment, research, method development, etc.) often do not conform to classical models. Uncertainity situations in which the dependent variable cannot be expressed continuously or a set of independent variables could be affected by different environmental factors are encountered [2,3]. Moreover, there are many uncertain situations such as the lack of suitable devices developed for measurement, the exact criteria for the classification procedures cannot be determined and the errors that may arise due to lack of sampling [4]. Shortly, assumptions for classical regression modeling are often difficult. In order to cope with such problems, the classical regression analysis method accepts errors between observed and predicted values as random variables. The fuzzy interval regression analysis model calculates the probability of being in these ranges by determining the lower and upper limit values (confidence interval) of the estimated dependent variable values [5]. Briefly, while the classical regression analysis method is based on probability theory, the fuzzy interval regression analysis approach is based on the possibilistic and fuzzy set theory [6].
One can face some problems in creating a predictive model where the dependent variable is expressed as continuous, but uncertain (i.e. a variable can have categories, classifications or segmentations as low, medium and high) [7]. The fuzzy approach can provide an alternative way to the classical regression analysis. The aim of this study is to calculate the fuzzy coefficient values and their deviations in the interval regression model and interpret them on obstructive sleep apnea syndrome (OSAS). It has been tried to show that more reliable and consistent results can be calculated by applying the interval regression on a small dataset consisting of some measurements for patients with sleep apnea.
The patients admitted to the Pulmonary Diseases Department of SDU Training and Research Hospital with OSAS (Obstructive Sleep Apnea Syndrom) complaint was the material of the study. The ethical approval was obtained from Süleyman Demirel University, Faculty of Medicine Clinical Research Ethics Committee (01/08/2019 dated and 30856962-813.99-E 234 issue). A total of 514 patients admitted with a suspicion of OSAS between the years of 2005 and 2016 were referred to the sleep clinic by examining with a polysomnography (PSG) device. The patients had snoring, drowsiness during the day, sleep apnea and OSAS symptoms. The patients with a sleep disorders were excluded from the study due to psychiatric reasons, sleep medication use, muscle relaxant use, patients under 18 years of age and other sleep disorder complaints.
The power analysis was performed by GPower 9.1.2 (Universitaet Kiel, Germany). The test family was selected as F statistics, and the method as "Linear multiple regression: Fixed model, R2 deviation from zero". The total sample size was determined as 35 with 0.5 effect size, 5% type-I error and 0.85 power for five predictors. Since there are two types of OSAS between the patients as positional and non-positional, then 35 patients for each group were selected randomly. This amount of sample size is already sufficient for interval regression. Because the applications of fuzzy approaches on fewer data sets yielded much better results. Five independent variables: Body Mass Index (BMI = X1), Rapid Eye Movement (REM = X2), Oxygen Desaturation Index (ODI = X3), Arousal (X4) and Apnea-Hypopnea duration (AH = X5) were determined as predictors on the dependent variable Apnea-Hypopnea Index (AHI).
The classical OLS regression and fuzzy interval regression models were established, and the coefficients were calculated. When the assumptions of the OLS couldn't met or the OLS model is not sufficient to determine the coefficients, a fuzzy interval regression model can be assumed to overcome the modelling problems. This type of model can be used in small samples to minimize the uncertainities of the datasets to determine more accurate results [7,8].
Moreover, mean squared error (MSE), the coefficient of determination (R2), residual analyses and the problems with multiple linear regression were used to decide the goodness-of fit and the performance of the models. The analyses of the study were performed by Microsoft Office EXCEL 2016 (R), LINGO 16.0 ve TURCOSA Analytic Solutions Version 1.0 softwares.
Interval regression analysis is one of the fuzzy regression analysis approach and the simplest form of probabilistic regression analysis method [8]. The main feature of the approach is the calculation of fuzzy linear regression coefficients in the range number type. Because of the coefficient values calculated in the range number type, all predicted fuzzy values of the dependent variable are calculated so that they obtain the most appropriate values in a range with the maximum dispersion level. In other words, the linear regression analysis model, created when the fuzzy tolerance level is h = 0.0, is called the interval regression analysis model [9-12].
In order to apply the interval regression analysis approach to the data sets consisting of exact values, the following systematic path should be followed [8,13];
i. Exact data sets (yi,yi), are arranged as i = 1,...,n,
ii. To calculate the values of the coefficient i = 1,2,...,n, of the range number type that minimizes the objective function J, the data is converted to the linear programming problem. For the objective function "J", solving linear programming problem:
is calculated as above [14,15].
Equation (1) asi ≥ 0, aci ≥ 0, i = 0,1,2,...,n corresponds to the value. The scattering index of the interval regression analysis model is applied to the fuzzy data under the lower limit and upper limit constraints in equation (1,2,3) to minimize total fuzziness. In order to limit the fuzziness of the coefficient values of the model between certain values, the objective function and constraint values must be analyzed together. A reliable solution to the problem is only possible by calculating the coefficient values of the range number type. The lower limit and upper limit constraints;
......
form. In the interval number property calculated under certain constraints, coefficient values are displayed as
Where aci, ac0 + ac1Xi1 + ... + ac(p - 1)Xi(p - 1), which consists of the values of the middle (center) value and asi; as0 + as1 |Xi1| + ... + as(p - 1) |Xi(p - 1)|. The values in the form of the coefficient values indicate the half-dispersion value. The coefficient values to be calculated are
is expressed by [14]. That is, by adding the interval operations to the fuzzy regression equation, the coefficients are calculated in the interval number type [16].
i. Interval regression analysis model to be formed using the coefficient values calculated under certain constraints,
were obtained by [14].
ii. Fuzzy dependent variable values of the calculated interval number type as a result of multiplying Xij independent (input) variables and model coefficients of interval number type which can represent the data of the investigated properties,
is expressed as. Here;
Membership function for the dependent variable (Yi) expressed as equation (6);
is calculated as above. For all calculated fuzzy output values, the lower and upper limit values generated,
are included in the forecast range [17,18].
According to the extension principle, the value of each observed dependent variable is estimated as a symmetrical triangular fuzzy number The limitations of the fuzzy linear regression analysis approach are made at any level hi determined by the researcher [18-20]. Observation values of the dependent Yi variable examined to calculate valid and reliable results with fuzzy interval regression analysis approach, the interval boundaries of dependent variable values estimated as fuzzy interval numbers condition. Under the constraints in equation (1), these values are calculated to predict the dependent variable values of the lower interval limits I to be within the limits satisfying the condition;
The sum of the regression squares (SSR) is the measure of the variation between lower and upper boundaries of The sum of squared error (SSE) is the measure of the variation of the differences that would occur if the central value of the dependent variable is used to predict the fuzzy dependent variable [19,21]. For positional and non-positional OSAS patients, the analyzing constraints and evaluating the models were performed by LINGO 16.0 software.
The classical OLS regression models were established for two OSAS types partitioning the training (71.5%) and test (%28.5) sets by "enter" method, that is, all independent variables were included into the models. In the model of positional OSAS (PPs), only ODI variable was found to be significant (Beta = 0.85; p = 0.001), so as in the model of non-positional OSAS (non-PPs) (Beta = 0.82; p = 0.027). The coeffficients of determination were very low and unacceptable in both models (R2 = 0.781 and R2 = 0.889). When the forward selection method was applied to the models, nothing was changed and R2 values were a little bit greater. As seen in Table 1, the coefficients of determination were too low and MSE values of the models were very high. Therefore, the models could be considered as unfitted. Moreover, the multiple linear regression assumptions were checked, and the residual analyses were performed. There were no autocorrelation and heteroscedasticity problems in both of the models. The Durbin-Watson statistics were found as 1.89 (positional) and 2.02 (non-positional) for the models. The standardized predicted vs. residual scatter plots indicated no heteroscedasticity (Figure 1 and Figure 2). Although the highest VIF values were low (VIFpositional = 1.421, VIFnon-positional = 1.713) for the models, the condition index values exceeded the threshold as 98.39 and 113.86. This showed that there is a slightly higher multicollinearity in the models. Thus, this explained why R2 values were high although most of the independent variables were not significant. In residual analysis, dFits, dfBeta and Cook's distance measures showed that there was only one outlier observation in each model.
Table 1: The coefficient of the classical OLS regression models (n = 35). View Table 1
 Figure 1: Scatter plot of predicted vs. residual of positional OSAS model.
View Figure 1
Figure 1: Scatter plot of predicted vs. residual of positional OSAS model.
View Figure 1
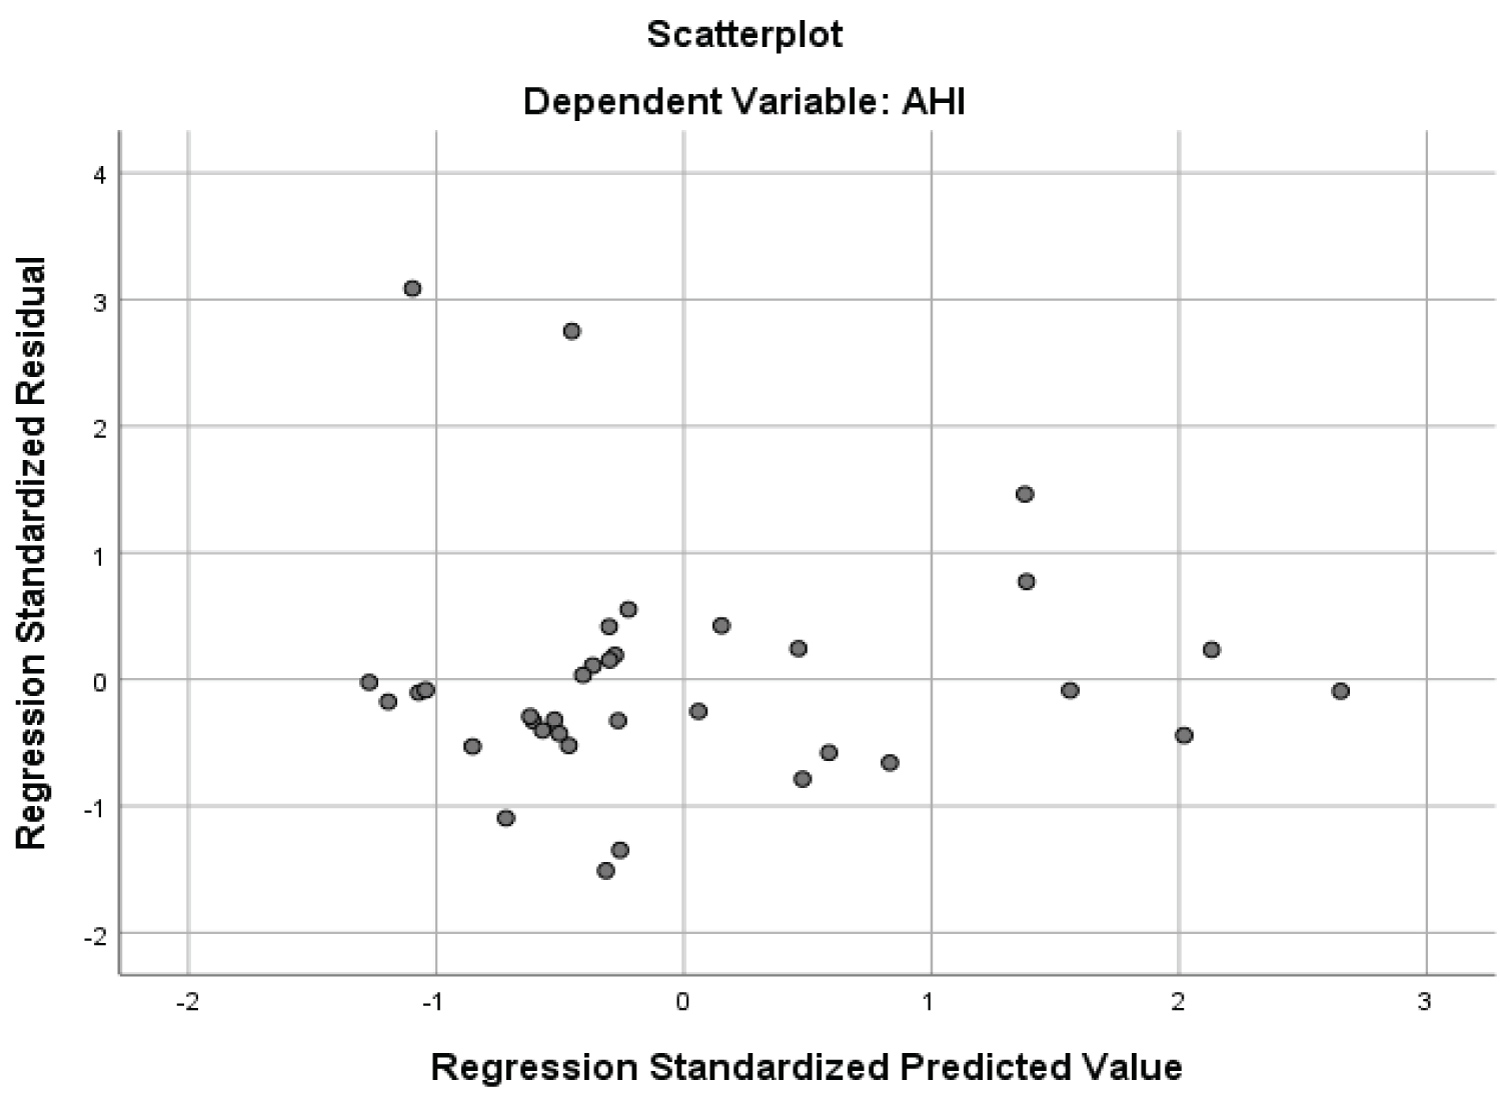 Figure 2: Scatter plot of predicted vs. residual of non-positional OSAS model.
View Figure 2
Figure 2: Scatter plot of predicted vs. residual of non-positional OSAS model.
View Figure 2
Using these values in the interval regression analysis method, fuzzy statistical values such as center values, dispersion, lower and upper limit values and MSE values were calculated.
i) As a result of following the systematic stages mentioned in the method section, the data was arranged.
ii) Equation (11) for the model to be at the minimum fuzziness level coefficient and dispersion values using the objective function in (1) for 35 Positional OSAS under 70 OSAS patients (both groups) with h = 0.0 fuzziness tolerance level constraint using;
... ..
conditions for coefficient values were created (Table 2).
Table 2: The center and dispersion values of coefficients calculated at h = 0.0 fuzziness tolerance level for models of positional OSAS patients. View Table 2
iii) Equation created using coefficient values in Table 2, calculated at h = 0.0 fuzziness tolerance, interval regression analysis model in (11);
= {1.5646; 1.4724} + {-0.0799; 0.1184}Xi(1) + {0.0091; 0.0891}Xi(2) + {1.0768; 0.0419}Xi(3) + {0.1276; 0.1153}Xi(4) + {0.0109; 0.0121}Xi(5)
was yielded.
iv) The value of the objective function Z(x) representing the fuzziness level of equation (11), as a result of the application of the dispersion values calculated in Table 3 as in equation (12),
Table 3: Estimated values of AHI (Apnea-Hypopnea Index) for non-positional OSAS patients. View Table 3
v) Using the equation (11) generated at the fuzziness level of Z = 773.9, the estimated AHI (Apnea-Hypopnea Index) values for the 35 Positional OSAS (PPs) patients and the lower and upper fuzziness limit values were calculated by MS-Office EXCEL (Table 4). There was no significant difference between the observed and predicted AHI values (p = 0.672) according to the calculated values at h = 0.0 fuzzy level in Table 4. MSE values for training, test and whole sets were found as 13.62, 11.08 and 28.16 respectively.
Moreover, the observed and predicted AHI (event/h) values for both model was compared by paired sample t-test. There was no significant difference between the predicted and observed AHI values for both positional and non-positional OSAS patients.
vi) The observed and the estimated AHI values were shown in Figure 3. It can be seen that the observed and estimated AHI values for PPs patients exactly coincided for 1st, 8th, 21st, 22nd, 23rd, 29th, 30th, 32nd, and 34th observations.
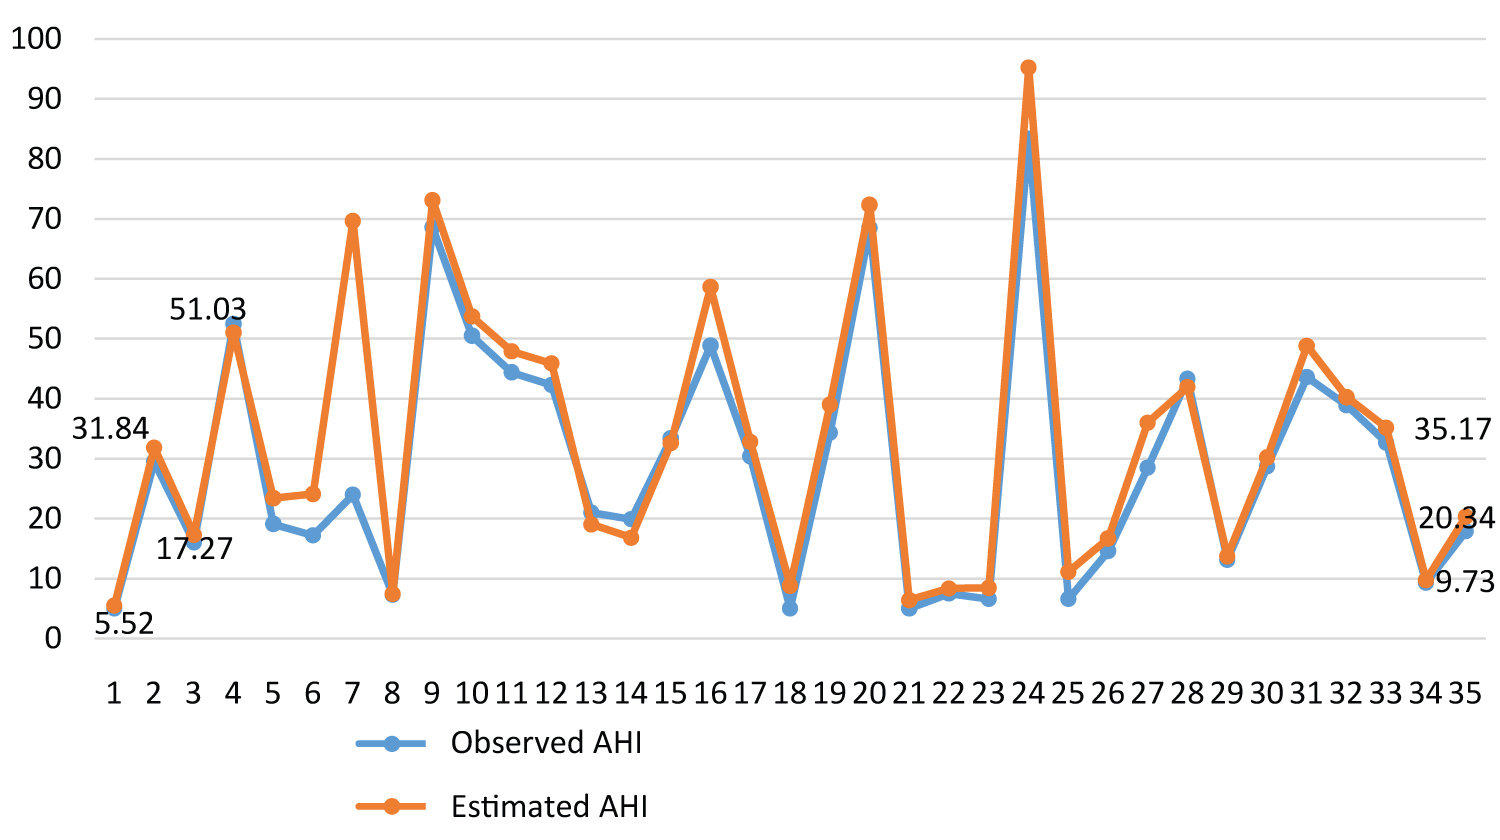 Figure 3: Line graphs of the observed and estimated AHI values for positional OSAS patients.
View Figure 3
Figure 3: Line graphs of the observed and estimated AHI values for positional OSAS patients.
View Figure 3
It can also be seen that there is a significant correlation between the observed and the estimated values of AHI with r = 0.994 in Figure 4.
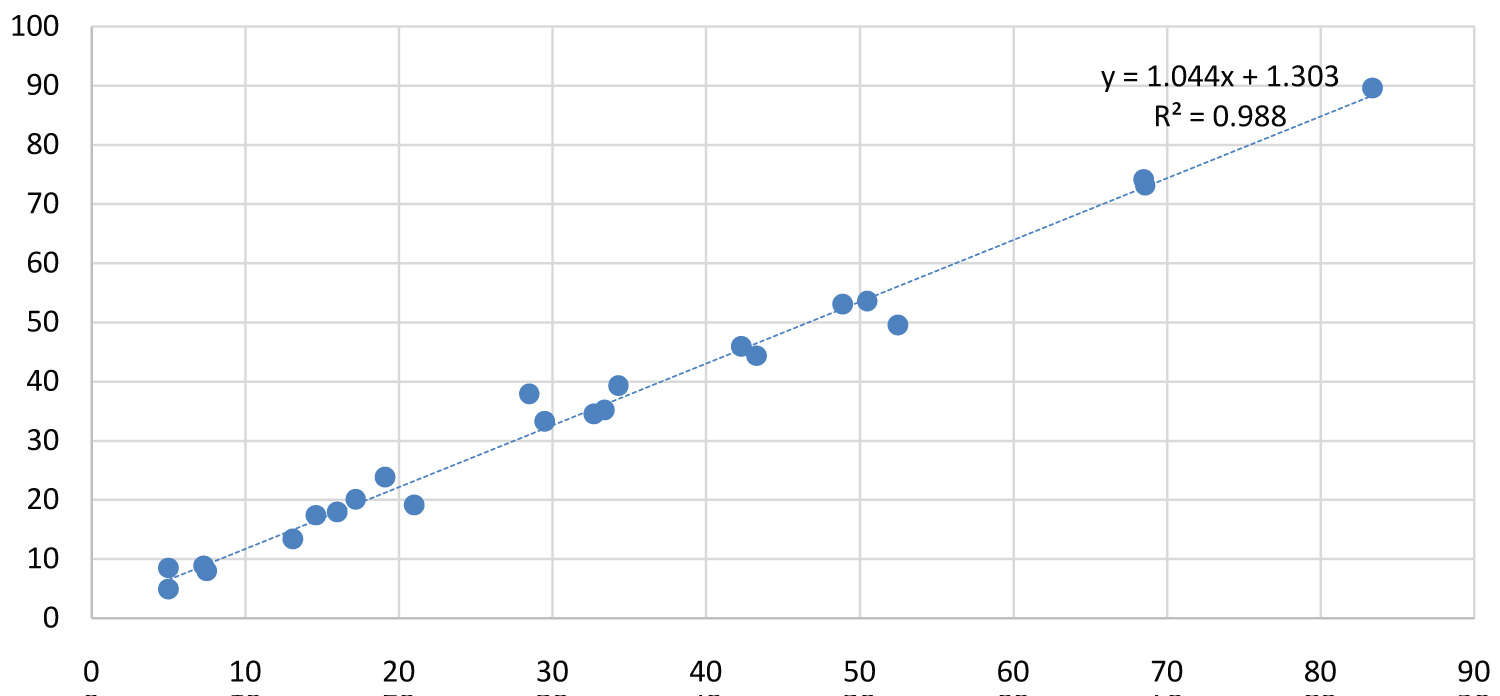 Figure 4: The correlation between the observed and estimated mean
AHI values for PPs patients.
View Figure 4
Figure 4: The correlation between the observed and estimated mean
AHI values for PPs patients.
View Figure 4
i) Similarly, the data for non-positional OSAS patients were analyzed
ii) Using the objective function in equation (1), (13) was obtained for 35 non-positional OSAS patients with h = 0.0 tolerance level and under the constraint 70 (35 observations*2) patients;
... ..
conditions for coefficient values were created. For non-positional apnea patients, the constraints created at h = 0.0 fuzziness tolerance level were analyzed and coefficient values of equality (3.4) were calculated as in Table 4.
Table 4: Estimated values of AHI (Apnea-Hypopnea Index) for positional OSAS patients. View Table 4
iii) Equation created using coefficient values in Table 4, calculated at h = 0.0 fuzziness tolerance, interval regression analysis model in 13;
iv) The value of the objective function Z (x) representing the fuzziness level of equation 13, applying the dispersion values calculated in Table 4 as in Equation (14),
v) Estimated mean AHI values, and lower and upper fuzziness limit values for 35 non-positional apnea patients using the equation (13) generated at fuzziness level at Z = 1129.54 were calculated and presented in Table 5. There was no significant difference between the observed and predicted AHI values (p = 0.772) according to the calculated values at h = 0.0 fuzzy level in Table 5. MSE values for training, test and whole sets were found as 25.62, 5.94 and 23.70 respectively.
Table 5: The center and dispersion values of coefficients calculated at h = 0.0 fuzziness tolerance level for models of non-positional OSAS patients. View Table 5
vi) The mean values and the estimated mean AHI values coincided at 1st, 3rd, 12nd and 33rd observations (Figure 5)
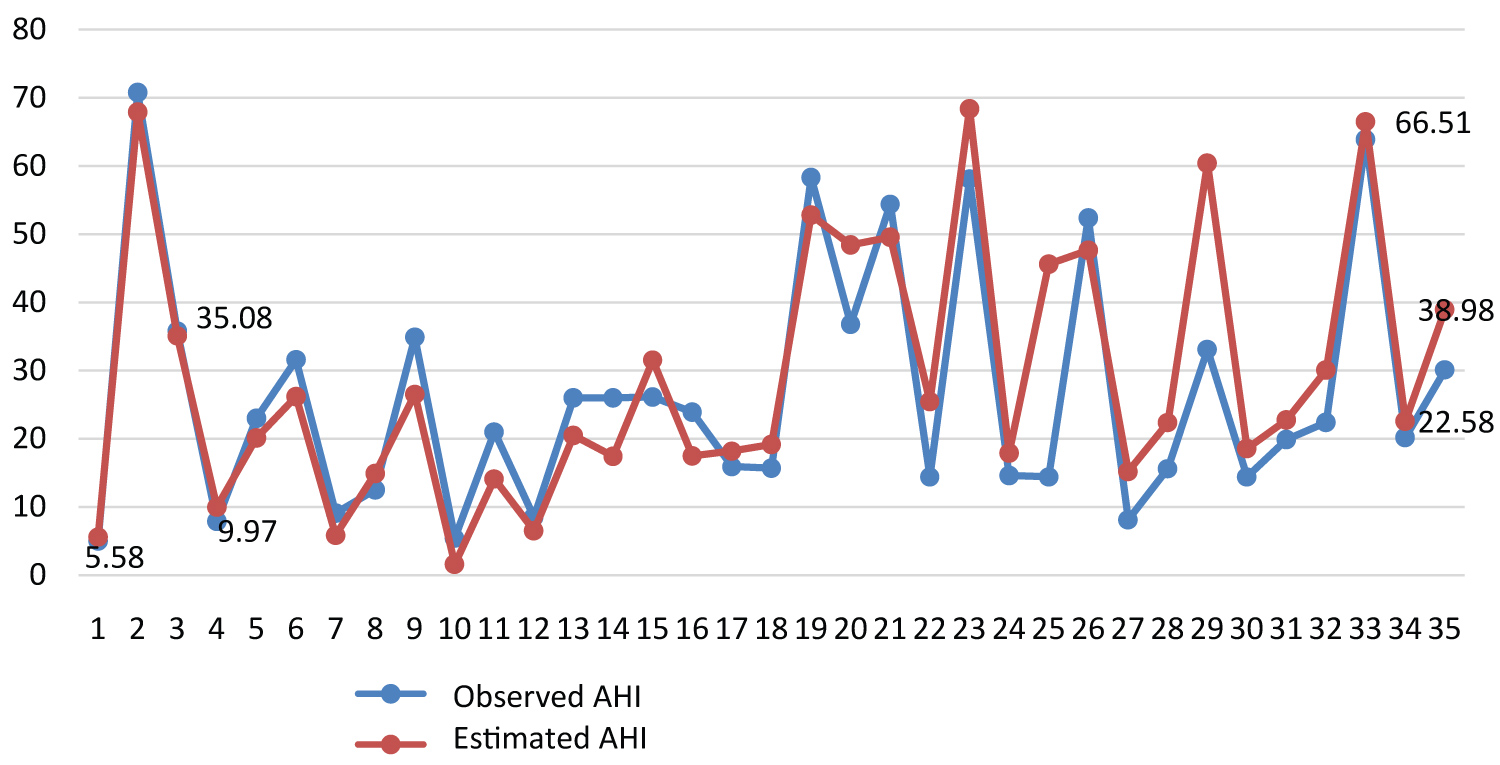 Figure 5: Line graphs of the observed and estimated
AHI values for PPs patients.
View Figure 5
Figure 5: Line graphs of the observed and estimated
AHI values for PPs patients.
View Figure 5
There was a significant correlation (r = 0.957) between observed and estimated mean AHI values for non-positional apnea patients (Figure 6).
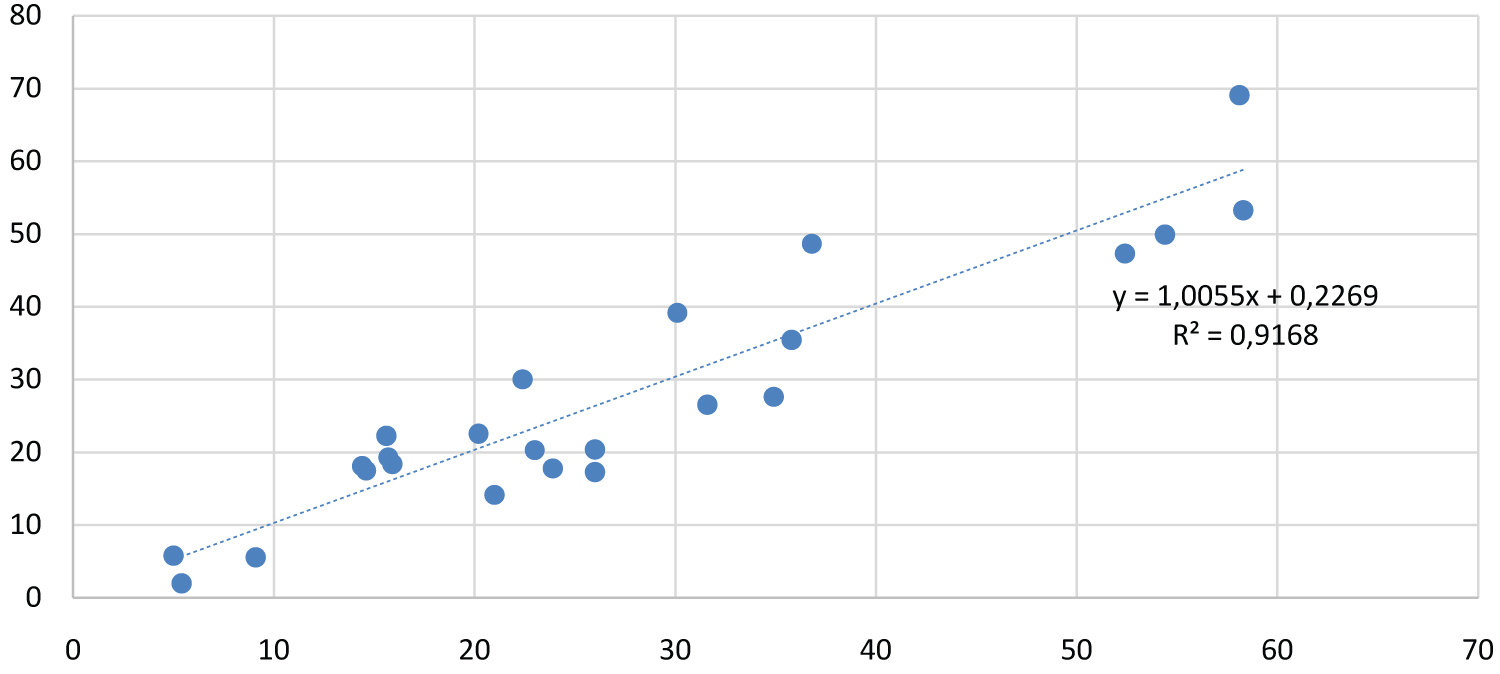 Figure 6: The correlation between the observed and estimated mean
AHI values for non-PPs patients.
View Figure 6
Figure 6: The correlation between the observed and estimated mean
AHI values for non-PPs patients.
View Figure 6
On the evaluation of the interval regression models, it can be said that the model for PPs was a better and more reliable as prediction. Because, there were three strongly significant (REM, ODI, AH-duration) and two moderate significant (BMI & AROUSAL) independent variables. The dispersion values of the strongly significant variables were close to zero. This means that the deviation is so small in the fuzziness interval. Therefore, the total fuzziness level value was lower and found as Z(x) = 773.9. Among the significant variables, ODI had a great contribution to explain AHI with a center value of 1.07. For example, AH-duration was significant on AHI but had a lower effect. For the model of non-PPs, the most significant variable was BMI, and had an effect of 5.52 on AHI. ODI was another significant variable on AHI with 0.0 dispersion. Only REM and AH-duration variables were moderate significant, and had higher dispersion values. According to the dispersion values, the objective function Z(x) = 1129.54 as a fuzziness level. Therefore, it can be seen that more reliable prediction values were obtained by calculating the average coefficients with minimum deviation at maximum uncertainity (fuzziness) level.
The application of interval regression in the field of health is not widespread. However, in some areas one can see many applications, especially in support vector regression applications. In a study, the support vector regression (SVR) approach with ε-insensitive loss function was proposed to solve a linear constrained quadratic programming problem in a training dataset [22]. Similarly, Hong and Hwang [23] studied interval regression using quadratic loss support vector machine, and it was claimed that the suggested method is attractive for nonlinear interval data. In another study, SVR with interval regression strategy was proposed to estimate the interval bounds for both linear and non-linear regressions in a simulated crisp dataset [24]. Hladik and Cerny [25] adapted tolerance analysis for interval regression in their study, and solved the problem of outliers in a crisp data. They, also, claimed that the method was more flexible to control the relative widths of interval parameters and simple to compute the results, even for large regression models. In a real house price dataset concerning the 32 cities in Korea, interval regression based on quantile techniques was proposed for upper and lower approximation modeling [26].
In some studies, fuzzy regression was extended into an approach in which the dependent and independent variables are both fuzzy [27]. In a recent study which is a little bit similar to this study, the authors dealt with the interval regression with endogenous independent variables. There were two applications: First one was a simulation study, second one was on a real survey data describing the behaviour of immigrants' remittance. Age, gender, education level, household income, presence of close relatives and intention to return to the home country were independent variables whereas the three remittance intervals (< 1000, 1001-5000 and > 5001 AUS $) was the dependent variable. It was shown that the method was effective for endogeneity of income and consumption in the context of remittance' behaviour [5].
In this study, valid and reliable results were calculated by interval regression model to determine the estimated values of AHI for patients with obstructive sleep apnea. OSAS is a disorder caused by respiratory obstruction during sleep. It has been reported to be the cause of many complications from cardiovascular diseases to obesity. In the advanced stage, it results in cerebrovascular events and sudden deaths. There are generally two phenotypes, positional and non-positional. Positional OSAS is a condition in which apnea occurs during sleep on their backs. OSAS, which is not related to the position, is a clinical condition that is mostly associated with REM sleep or characterized by arousals as a result of obstruction of the upper airway [28]. Polysomnography (PSG) is the gold standard diagnostic method for Obstructive Sleep Apnea Syndrome.PAP (Positive Airway Pressure) is the gold standard method of treatment. Although it is recommended mainly in patients with moderate and severe OSAS (AHI > 15), PAP treatment is recommended if comorbid diseases are present, even in mild patients. RDI (Respiratory Disturbance Index) is the most important factor showing position dependence in OSAS patients. Obesity, age or concomitant respiratory or cardiovascular diseases are also among the risk factors. However, a clear distinction between positional (PPs) and non-positional OSAS (non-PPs) patients has not yet been established. PPs patients can turn into non-PPs patients as violence increases because non-PPs patients have a more disturbed sleep structure [29,30].
Worsening of breathing while sleeping in the supine position is more common in male patients. Although one of the reasons is obesity, the increase in respiratory events is also interestingly observed in normal-weight patients. This is probably due to the fact that the tongue falls back due to gravity in the pharyngeal region [31]. In general, better sleep quality and less arousal are observed in the PPs group compared to the non-PPs group. However, despite higher RDI and less frequent oxygen saturation, severe OSA is seen in the supine position [32].
In this study, classical OLS regression and fuzzy interval regression models were compared. Prediction models for AHI values were established with the measurements obtained from polysomnography device for positional and non-positional types for OSAS patients. Since there was no interval regression analysis study conducted in the field of health, the results obtained could not be compared. However, in the study, the superiority of the fuzzy interval regression method was tried to be shown by comparing two different methods. In this case, the OLS regression analysis cannot give accurate results for such a dataset. The OLS models cannot be considered as sufficient, and the independent variables except for ODI are not significant and MSE values are higher than the interval regression models. Therefore, applying the fuzzy regression analysis approach allows experts to make more valid and reliable results. Especially, the interval regression can give us a more reliable and consistent model if there is a collinearity problem in a model or outlier observations in a dataset. The only ODI was found to have a significant effect on the AHI of both PPs and non-PPs patients in OLS models. In fuzzy interval regression models, all the affecting variables have a significant contribution to the model. It is observed that the MSE values of the models are quite low. It can be also shown that the estimated AHI values obtained with fuzzy models were substantially equal to the observation values.
There are, of course, some limitations in this study. The first limitation is the sample size of the study. The interval regression method works in smaller datasets better, and we have selected 35 patients for each groups for both OLS and interval regression models. However, there were 514 eligible patients in the dataset. Therefore, it can be determined different coefficients and significance values for different samples. The second limitation is that there is no common comparable measure between the OLS and the interval regression method. It is necessary to calculate some similar measures between the models. This situation causes to make some additional analyses. Moreover, the interval regression is a long process, and if the sample size is big then one should calculate the fuzziness tolerance values as the sample size.
The change in current problems implies the researches to have a more complex structure. This case reveals the necessity of changing the structure of classical regression models with different techniques. Therefore, new alternative approaches have been developed and an interval regression analysis approach has been applied in many areas. It can be explained that if the dependent variable is continuous and uncertain, and independent variables consist of continuous variables measured at all levels, it can be used as a discrimination model in the grouping of observations. In this study, it was shown that the interval regression analysis model achieved in estimating the dependent variable (AHI) in OSAS patients' dataset. Therefore, the factors affecting the PPs and non-PPs can be detected more carefully in diagnosis, and the treatment can be planned more effective for OSAS. It can be concluded that the researchers studying in the healthcare area are able to use the interval regression modeling to get more accurate results under appropriate conditions.