This study features a survey of the concentrations of heavy metals (Cu, Cd, Cr, Ni, Pb, Mn, Co, Se) in surface soils (0-30 cm), carried out in edge of Sichuan Basin (Pingdi, Puan, Xingwen, Gulin). The contamination of heavy metals in soil was assessed with single-factor pollution index method and Nemerow comprehensive pollution index method. The results showed that Cu, Cr, Ni, Pb, Co were main risk factors of soil heavy metal pollution. In Gulin, the concentrations of Cd, Mn and Se were higher than other three areas, with the sample over-standard rate of 90, 20 and 30%. The Nemerow assessment showed that the comprehensive pollution index of Gulin was above 1, while Pingdi, Xingwen, Puan was below 1. It indicated that the soil in Gulin was slight polluted, and the soil in Pingdi, Xingwen, Puan were clean.
Farmland soil, Heavy metals, Pollution assessment
Heavy metal is a kind of typical POPs, though many ways entering the soil, such as the sewage Irrigation, air dry and wet deposition, sludge use in agriculture. Because of poor mobility and degradability, easily absorbed by plants, it decrease the crop yield and quality [1-3]. Heavy metals also damage human healthy through food chain transferring the human body [4-6]. Recently, There are abundance reports on the Arsenic Poisoning, Cadmium Rice, Blood Lead, soil heavy metals pollution has become one of the most severe problem in soil pollution [7-8].
Sichuan is a major agricultural province in China, with second large arable flied area in China. Agricultural products quality is closely related to the purity of soil. It's necessary to measure and evaluate the soil heavy metals pollution in order to guarantee the sustainability of agricultural products' quality and safety. Since the 1980s, researchers have began to focus on the heavy metals pollution in Chendu Plain, but few report on the risk assessment of farmland heavy metals contents on the edge of Sichuan [9-12]. We measured the heavy metal contents in Pingdi, Puan, Xingwen, Gulin, offering a reference for improving soil quality and ensuring agricultural products safty through evaluated and analysis the heavy metals pollution.
Soil samples are collected in four areas: Pingdi town in Panzhihua, Puan town in Guangyuan, Gulin town in Luzhou, Xingwen Town in Yibin. Pingdi town is located in southwest of Sichuan, with the coordinates N:26°5',E:101°73', belonging to the South Asian tropical climate with great differences in temperature during day and night. The annual average temperature is 20.4 ℃. The annual sunshine hours is 2745 h, The frost-free period exceeds 300 days. Red soil in the area of Pingdi is newly reclaimed. Puan town is located in north of Sichuan with the coordinates N: 31°62', E: 105°41', the annual average temperature is 15.4 ℃, the annual average precipitation is 1039.4 mm, the frost-free period exceeds 270 days. Calcareous purple soil in the area of Puan is newly reclaimed. Gulin town is located on the southern edge of Sichuan, with the coordinates N: 27°41'-28°20', E: 105°34'-106°20'. The annual average temperature is 18.0 ℃, the annual average precipitation is 748.4 mm-1112.7 mm. The soil type of this area is acid purple soil which the previous crop was vegetables. Xingwen county is located on the southern edge of Sichuan Basin, with the coordinate N: 28°04'-28°, E: 104°52'-105°21', belonging to the Subtropical humid climate, the annual average precipitation is 1234.7 mm, the annual average temperature is 17.4 ℃, the soil type of this area is neutral purple soil which the previous crop was tomato (Figure 1).
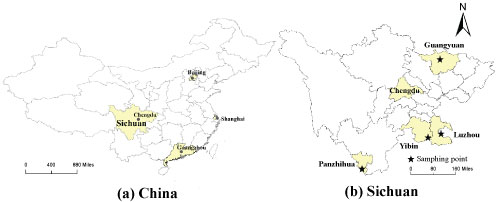 Figure 1: The study areas.
View Figure 1
Figure 1: The study areas.
View Figure 1
All 30 (10 in Pingdi, 3 in Puan, 5 in Gulin, 12 in Xingwen) Soil samples (0-20 cm depth from the surface) were collected using a stainless steel auger according to soil environmental monitoring technical specifications (HJ/T166-2004) [13]. Soil were taken from 8 sites chose in every test place, making a 1 kg composite sample by four quarter method. All solid samples were ground in a mortar to pass through a 100-mesh polyethylene sieve and stored in a desiccator, and stored at 4 ℃ in a refrigerator prior to chemical analyses.
Solid samples were digested in a poly-tetrafluoroethylene container with a mixture of HNO3 (5 mL) - HF (1 mL) - HClO4 (1 mL). The mixture was heated at 180 ℃ for 10 h, cooled to room temperature, and diluted with deionized water to 30 mL. The aqueous samples were acidified to pH 1.5 with 4 mL sub-boiling quartz distilled 6N HCl per 1 L of sample [14] (reference to the method). Concentrations of Pb, Cd, Cr, Mn, Se and Ni were determined using inductively coupled plasma-mass spectrometer (ICP-MS, Agilent 7500a, USA) [15,16]. Sample replicates, reagent blanks, and standard reference materials (GBW07429, the National Research Center for Certified Reference Materials of China) were included in each batch of analysis to ensure the quality of analysis. The recovery of spiked standard for each element ranged between 90 and 110%.
Using the simple heavy metals pollution assessment method can evaluate the dominate heavy metals pollution degree which is indicated by pollution index. Single-factor heavy metals content evaluation standards with reference to soil environmental quality standards (C3B15618-1995) [17] secondary standard which is for agricultural production and human health (Table 1). Pollution index of each metal was calculated using Eq.(1).
Table 1: The physical and chemical characterization of soils in four study areas. View Table 1
Where is the heavy metal concentration in soil (mg/kg); is the metal reference concentration in the secondary standards (mg/kg). An below the value of 1 indicates negligible risk of heavy metals effects while an above 1 indicates the soil has been polluted, the value of is positive correlated with the pollution degree.
Soil pollution is divided into five degrees (Security level, alert level, light pollution, Moderate pollution and heavy pollution) by comprehensive pollution index with reference to the HJ/T166-2004 (Table 2) [18]. Nemerow index is one of the most common methods of calculating soil heavy metals pollution index [19-21]. Compared with the simple pollution index, Nemerow index indicates soil heavy metals pollution comprehensively. Nemero index (PN) of each metal was calculated using Eq. (2).
Table 2: The standard value of soil heavy metals contents (mg/kg). View Table 2
Where Pmax is the max of each heavy metal simple pollution index; Pave is the average of each heavy metal simple pollution index (Table 3).
Table 3: The grading standards of soil pollution. View Table 3
Cd concentrations in the four study areas varied from 0.03-0.96 mg/kg where the Cd average concentration in Gulin (0.43 mg/kg) is significantly higher than it in Puan (0.29 mg/kg), Xingwen (0.17 mg/kg) and Pingdi (0.1 mg/kg), respectively; t-test, p < 0.05. Single-factor pollution assessment indicated that 90% of soil samples in Gulin and 16% in Puan were above the secondary standard. Cu concentrations in the four study areas varied from 4.37-29.31 mg/kg, ranked in the following order: Gulin (22.14 mg/kg) > Puan (15.45 mg/kg) > Xingwen (12.8 mg/kg) > Pingdi (8.323 mg/kg). CV of Cu concentrations in the four study areas were about 30%. Ni concentrations in the four study areas varied from 4.57-26.3 mg/kg, ranked in the following order: Gulin (26.23 mg/kg) > Xingwen (19.48 mg/kg) > Puan (16.48 mg/kg) > Pingdi (10.7 mg/kg), and Ni concentration in Gulin and Xingwen were significantly (p < 0.05) higher than those it in Puan and Pingdi. Pb concentrations in the four study areas varied from 0.064-109.03 mg/kg, ranked in the following order: Puan (26.23 mg/kg) > Gulin (25.3 mg/kg) > Pingdi (16.9 mg/kg) > Xingwen (0.72 mg/kg), with the no significant (p < 0.05) difference in each area. Cr concentration in the four study areas varied from15.9-109.03 mg/kg, ranked in the following order: Gulin (102.5 mg/kg) > Puan(61.5 mg/kg)> Pingdi (55.5 mg/kg) > Xingwen (17.22 mg/kg), and Cr concentration in Gulin was significantly (p < 0.05) higher than those in Puan, Pingdi and Xingwen. Mn concentration in the four study areas varied from 150.9-1721.1 mg/kg, ranked in the following order: Gulin (1159.15 mg/kg) > Puan (585.5 mg/kg) > Pingdi (318.7 mg/kg) > Xingwen (260.6 mg/kg). Mn concentration in Gulin was significantly higher than it in Puan which is higher than those in Xingwen. Single-factor pollution assessment indicated that 20% of soil samples in Gulin were above the secondary standard while Mn concentration in the other areas were under the secondary standard. Co concentration in the four study areas varied from 2.09-13.39 mg/kg, ranked in the following order: Gulin (12.06 mg/kg) > Xingwen (10.85 mg/kg) > Puan (6.68 mg/kg) > Pingdi (3.57 mg/kg). Se concentration in the four study varied from 0-1.16 mg/kg, ranked in the following order: Gulin (0.76 mg/kg) > Puan (0.31 mg/kg) > Pingdi (0.24 mg/kg) > Xingwen (0.18 mg/kg), single-factor heavy metal pollution assessment indicated that 30% of soil samples in Gulin were above the secondary standard while Se concentration in the other areas were under the secondary standard.
The eight heavy metals content assessment in the four study areas indicated that the each heavy metal concentration was highest in Gulin followed by Puan, Pingdi and Xingwen. In Pingdi, CV of each heavy metals was above 30%, especially, CV of Pb, Cd, Ni were 76.35%, 47.42% and 47.09%, which probably result from a small number of soil sample. In Puan, CV of Cd, Pb and Se were 96.59%, 70.00%, 57.11%, respectively, while CV of other heavy metals were under 30%, which indicated those three metals were uneven distribution. In Xingwen, CV of Se was highest (89.95%) while CV of other metals were under 25%. In Gulin, CV of the metals is below 35% which indicated high data reliability.
Heavy metals pollution assessment in the four study areas was presented in (Table 4). Single-factor pollution index of each heavy metals in Pingdi were below 1, ranked in the following order: PCr(0.27) > PCd(0.26) > PSe(0.25) > PNi(0.22) > PMn(0.21) > PCu(0.10) > PCo(0.09) > PPb(0.06), suggesting that the soil in Pingdi is safety. Single-factor pollution index of each heavymetals in Puan were below 1, ranked in the following order: PCd(0.53) > PMn(0.39) > PSe(0.31) > PNi(0.29) > PCr(0.27) > PCo = PCu(0.17) > PPb(0.08), suggesting that the soil in Puan is safety. Single-factor pollution index of each heavy metals in Xingwen were below 1, ranked in the following order: PCr(0.55) > PNi(0.41) > PCo(0.27) > PSe(0.18) > PMn(0.17) > PCu(0.15) > PCr(0.09) > PPb(0.01), suggesting that the soil in Xingwen is safety. Single-factor pollution index of Cd in Gulin was 1.43, above 1 while the index of the other metals is below 1, ranked in the following order: PCd(1.43) > PMn(0.77) > PSe(0.69) > PCr(0.68) > PNi(0.51) > PCu(0.44) > PCo(0.30) > PPb(0.10), indicating Soil was contaminated by cadmium. Overall, PCd, PMn, PSe, PNi were higher than the index of other metals in the same areas, suggesting that Cd, Mn, Se, Ni were the main risk factors of the four study areas soil. Nemerow comprehensive pollution index of the four study areas was presented in (Table 4), ranked in the following order: Gulin (1.10) > Xingwen (0.42) = Puan > Pingdi (0.23), high heavy metals concentrations in Gulin and Xingwen could be due to the sample soil in Gulin and Xingwen were ripening soil while in Puan and Pingdi were the newly reclaimed soil. Nemerow comprehensive pollution index of Gulin was 1.10, above 1, suggesting that the soil was light pollution. Nemerow comprehensive pollution index of Xingwen, Puan and Pingdi all were below 1, indicating that the soil were safety (Table 5).
Table 4: The content of heavy metals in four study areas (mg/kg). View Table 4
Table 5: The assessment of heavy metals pollution in four study areas. View Table 5
The eight heavy metals (Cd, Cu, Ni, Pb, Cr, Mn, Co, Se) concentrations in Gulin all were significantly higher than Puan, Pingdi and Xingwen. The CV of heavy metals in Pingdi and Puan were higher. The single-factor pollution index method indicated; (1) In Gulin, 90%, 20% and 30% of soil samples were above the secondary standards of Cd, Mn and Se, respectively; (2) In Puan, 16% of soil samples were above the secondary standards of Cd. And the heavy metals concentration in Pingdi and Xingwen were below the secondary standards.
The single-factor pollution index of Cd in Gulin was above 1 while the index of eight metals in other three study areas were below 1, suggesting the soil in Gulin was lightly contaminated by Cd. Cd, Se, Mn, Ni were the main pollution risk factors in study areas, resulted from those high value of single-factor pollution index.
Nemerow comprehensive pollution index of Gulin was above 1 while it in Pingdi, Xingwen, Puan were below 1, indicating that the soil in Gulin was lightly polluted and soil in other areas were safety.
The research was financially supported by the National Natural Scientific Foundation of China (No. 41571315).