Renal disease is a major global public health issue. Renal interstitial fibrosis is the characteristic histopathological finding in all progressive renal disease. Caveolin-1 is the essential structural protein for lipid rafts called caveolae that are ubiquitously distributed among fibroblasts, endothelial and epithelial cells. Caveolin-1 acts as an intracellular signalling pathway chaperone in fibrotic disease. Presently, caveolin-1 expression is associated with more severe renal disease in human and previous murine studies. In non-renal fibrosis, caveolin-1 protects against fibrosis. The purpose of this study was to investigate if caveolin-1 knockout led to an increased fibrotic phenotype using the unilateral ureteric obstruction model of renal fibrosis.
Using 2 time-points of the unilateral ureteric obstruction model, wild-type and caveolin-1 knockout mouse kidneys were analysed for caveolin-1 expression and markers of fibrosis using histology, Gomori staining, real-time quantified polymerase chain reaction, Western blotting and confocal microscopy.
Confocal microscopy shows caveolin-1 staining mainly in glomerulus, lining of tubules as well as the vasculature. There was increased caveolin-1 expression the longer the unilateral obstruction occurred as well as in the contralateral compensating non-obstructed kidney. Caveolin-1 knockout had less fibrosis at day 3 histologically but more at day 14 as compared to wild-type. There were significantly more F4/80 positive staining cells at day 3 and day 14 in the wild-type injured kidney as compared to the caveolin-1 knockout mouse.
Caveolin-1 knockout leads to a worse fibrosis upon unilateral ureteric obstruction. Caveolin-1 expression manipulation timing remains to be elucidated in reducing renal fibrosis.
Caveolin-1, Fibrosis, Unilateral ureteric obstruction
Renal disease is a major global public health issue that affects estimates of 10-16% of the general population in developed countries leading to premature morbidity and mortality [1]. Thus, it remains paramount to prevent the progression to end-stage renal disease. Renal interstitial fibrosis is the final characteristic histopathological finding in all progressive kidney diseases even if glomerular in origin. It mainly involves an accumulation and dysregulation of extracellular matrix but also consists of tubular atrophy, glomerulosclerosis, loss of glomerular and peritubular capillaries, and characterised by macrophage influx.
Caveolae are sub-class of non-clathrin coated lipid rafts that appear as little cave-like invaginations of the plasma membrane of 50-100 nanometres in size [2]. Caveolae are ubiquitously distributed though predominately found in endothelial cells, epithelial cells and fibroblasts [3,4]. Caveolin-1 (Cav1) is an essential protein for its formation and structural stability. Cav1 acts as an intracellular signalling pathway chaperone in human fibrotic and vascular diseases [3,5]. Our group has previously shown that donor Cav1 rs4730751 single-nucleotide polymorphism (SNP) is associated with renal transplant fibrosis and vascular disease in two independent kidney transplant cohorts [6]. The CC genotype of this SNP has also been shown to have a protective association with outcomes of anti-neutrophil cytoplasmic antibody-associated vasculitis patients with renal impairment and with reduced arterial stiffness in CKD [5,7].
However, unlike other organs, Cav1 has been regarded as injurious to the development of renal impairment. In a progressive CKD subset of children with congenital unilateral ureteropelvic junction obstruction with grade IV hydronephrosis, the expression of urinary Cav1 was found to be increased [8]. Moriyama, et al. have shown a histological increased glomerular expression of Cav1 in Japanese patients in diseases that target the glomerulus such as diabetic nephropathy, membranous nephropathy and focal segmental glomerulosclerosis [9]. It was also noted that Cav1 expression was also reduced in glomerular endothelial cells with the use of steroids. In diabetic nephropathy, murine Cav1 knockout led to a worse glomerulosclerosis and albuminuria in the streptozotocin model of type 1 diabetic nephropathy, though there is limited tubulointerstitial fibrosis in this model [10].
Thus the purpose of the present study was to investigate if Cav1 knockout led to an increased fibrotic phenotype from its wild-type control using the unilateral ureteric obstruction model (UUO) of renal fibrosis.
Mice bought from JAX (Jackson Laboratory, USA) via Charles River (UK). The Cav1 knockout (CKO) and control wild-type mice were from this same strain, due to known differing propensities to develop renal fibrosis between mouse strains. Both CKO and wild-type strains were inbred at purchase, with a colony established at the Biomedical Sciences Unit, Birmingham, UK. For all experiments, litter-matched males were used only at age 6-8 weeks. Mice were maintained in 12-hour light/12-hour dark cycles with free access to food and water. Briefly, UUO was performed by midline laparotomy after being anaesthetised (4% Isofluorane, 3 L/min oxygen) and placed on a heated surgical pad; the left ureter was identified and ligated at 2 points for either 3 or 14 days. Sham-operated control mice underwent an identical procedure except that the left ureter was mobilized but not ligated.
Genomic DNA was isolated from newborn mice ear clippings. DNA was then extracted using the DNAeasy Tissue Kit (Qiagen) using the manufacturer's instructions. Mice were then genotyped for caveolin-1 wild-type (WT) or knockout (KO) using primers (AltaBioscience, Table 1).
Table 1: Primers used for mouse genotyping for caveolin-1. View Table 1
Mice were weighed pre-surgery and prior cervical dislocation. There are wide variations in collagen content depending on the area of kidney investigated, thus areas of pre-injury high collagen concentrations (renal capsule and renal pelvis) were removed (186). Also, the same pole was used for analysis in all subsequent experiments via respective quarters of kidney sectioned for real time polymerase chain reaction, western blotting, histology and confocal microscopy.
The right upper quarter kidney was placed in 4% paraformaldehyde (PFA) for 2 hours, and then kept in 18% sucrose overnight at 4 ℃. The tissue was then embedded in a cryomold (Tissue-Tek) containing optimum cutting temperature compound (OCT) and froze using the vapour of liquid nitrogen. 6 µm sections were prepared using a cryostat and fixed by immersion in cold acetone for 20 minutes at 4 ℃, and allowed to air dry for 30 minutes. The slides were frozen at -80 ℃ for storage. Primary and secondary antibodies (as per Table 2 and Table 3) were diluted in phosphate buffered saline (PBS) containing 1% bovine serum albumin (BSA), 2% foetal calf serum. Primary antibodies were incubated overnight at 4 ℃. The secondary antibody was incubated for 1 hour at room temperature. Nuclei staining was performed with DAPI (4',6-diamidino-2-Phenylindole, dihydrochloride from Invitrogen). The slide was then fixed in 1% PFA, before a cover slip was mounted using VectaShield mounting medium (Vector Laboratories). The slides were then stored in the dark at -20 ℃ until visualisation using the Zeiss confocal LSM 510 microscope and processed using the LSM Image Examiner software (Zeiss, Germany). Images are presented with respect to the objective used of the microscope (×10, ×40 or ×63). F4/80 is used to stain for macrophages but it is noted that dendritic cells could also be stained.
Table 2: Primary anti-mouse antibodies for confocal microscopy (IF: immunofluorescence) and Western blotting (WB). View Table 2
Table 3: Secondary antibodies for confocal microscopy and Western blotting. View Table 3
Sections were obtained as described above in 'Confocal microscopy' but from the right lower kidney quadrant. They were stained using haematoxylin and eosin and for collagen using Gomori trichrome staining and then imaged the sections digitally using the Nikon Eclipse E400 microscope and NIS Elements Version 3.0 (Nikon). The kidney images were then analysed for percentage Gomori staining for collagen (as a surrogate for fibrosis scoring) in a blinded fashion by renal histopathologist, via a 5 × 3 grid-grid method.
The left upper quarters of sectioned kidney were snap frozen in a cryovial in liquid nitrogen and kept frozen at -80 ℃ until analysis. The whole quarter was homogenised using the gentleMac dissociator and M tubes (Miltenyi Biotec) with an equivalent volume to a maximum of 30 mg of tissue homogenised. RNA was extracted using the RNEasy Mini Kit (Qiagen). 1 µg of RNA was used in each reverse transcription reaction to cDNA using the Taqman Reverse Transcription (Applied Biosystems).
Quantitative PCR was performed on 384 well plates, single plex, using the following Taqman Gene Expression assays TGFβ-1 (Mm01178820_M1 FAM-MGB), collagen 1α1 (Mm00801666_M1 FAM-MGB), collagen 3α1 (Mm01254476_M1 FAM-MGB), caveolin-1 (Mm00483057_M1 FAM-MGB) and GAPDH (Mm99999915_g1 VIC-MGB) was used as a housekeeping gene. Assays were run using the Lightcycler 480 II (Roche). Sham operated mice was used as control. Relative fold induction to control was calculated using the 2-ΔΔCt (delta-delta) method. Fold increase ratios were then expressed to demonstrate fold changes between groups.
Tissue lysates were prepared using the gentleMACs M tubes for homogenisation from the left lower quarters of sectioned kidneys. Each sample was placed in 890 µl sterile PBS, 100 µl of 10 × RIPA lysis buffer (Sigma-Aldrich) and 10 µl of protease cocktail inhibitor (Calbiochem) prior to homogenisation. The lysate protein concentration was then assayed using Pierce BCA protein assay (ThermoScientific). Cold 20% trichloroacetic acid (TCA) was used for pellet formation. 60 µl of × 2 sodium dodecyl sulphate (SDS) sample buffer (4% SDS (Geneflow, UK); 0.1 M dithiothreitol (Sigma-Aldrich); 20% glycol (BDH Limited, UK); 0.0625 M Tris-HCL (pH 6.8); 0.004% bromophenol blue (Sigma-Aldrich)) were added and boiled for 5 minutes at 100 ℃.
20 µl of equal protein concentration of lysates were then loaded onto a 12% SDS-polyacrylamide gel and run for 1.5 hours at 100 volts with pre-stained markers (BioRad). Proteins were then wet transferred on to methanol-activated 0.2 µm polyvinylidene difluoride membranes (Biorad). Following blotting, membranes were washed quickly with Tris buffered saline (TBS) containing 0.1% tween-20 (Sigma-Aldrich) (TBS-T), then incubated with 5% BSA/TBS-T at room temperature for a minimum of an hour. Overnight at 4 ℃, blots were probed with anti-mouse caveolin-1 antibody (Santa-Cruz Biotechnology), 1:500 dilution in 5% BSA/TBS-T on an orbital shaker. The blot was then probed with an anti-rabbit HRP secondary antibody (Dako), 1:5000 dilution in 5% BSA/TBS-T for 1 hour at room temperature. Proteins were visualised with enhanced chemiluminescence prime (Amersham Pharmacia Biotech) and proteins imaged using the Chemidoc (Biorad). After 4 washes with TBS-T the blot was probed with anti-mouse β-actin antibody (Sigma-Aldrich), 1:5000 dilution in 5% BSA/TBS-T for 1 hour at room temperature; the same process of washes and secondary anti-rabbit HRP antibody incubation, enhanced chemiluminescence prime visualisation and imaging was performed to confirm equal protein loading.
Results are presented as mean ± standard error of the mean (SEM). Statistical mean difference was assessed by a two-tail Student's t test if normally distributed, otherwise Mann-Whitney U testing was used. One-way ANOVA was used to compare the difference between three groups and post-hoc analysis with Dunnett's multiple comparison test. Analysis and graphical data were prepared by either GraphPad Prism 5 software or SPSS software, version 21 (SPSS Inc., Chicago, Illinois).
Confocal microscopy shows caveolin-1 staining mainly in glomerulus, lining of tubules as well as the vasculature (Figure 1 and Figure 2).
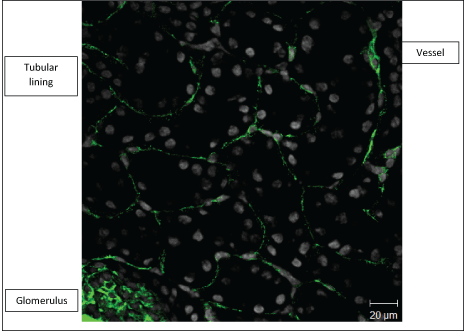 Figure 1: Confocal microscopy showing caveolin-1 staining (green) in a × 40 objective of the Zeiss confocal LSM 510 microscope image of a wild-type mouse kidney frozen section. Nuclei appear as grey with DAPI staining. View Figure 1
 Figure 2: Confocal images of the wild-type non-injured kidney (× 63 objective of the Zeiss confocal LSM 510 microscope). Caveolin-1 (green) confocal images with red staining for a) CD31; b) E-cadherin; c) Alpha smooth muscle actin; d) Synaptopodin; e) CD45; f) CD3e; g) F4/80. Nuclei appear as grey with DAPI (4',6-diamidino-2-Phenylindole, dihydrochloride) staining. View Figure 2
Cav1 co-localises with endothelial cells (CD31), especially in the glomerular endothelium, and its staining with vasculature (αSMA). Cav1 proximity to tubular epithelial cells (E-cadherin) and podocytes (synaptopodin) is also shown in Figure 2. αSMA is a marker of myofibroblasts that were not present in the non-injured kidney.
F4/80 positive staining cells are the most prominent white cell shown (Figure 2). For all confocal images, Cav1 staining is coloured green, other antibody staining red, nuclei staining grey and merged co-localisation yellow.
Upon UUO injury, the left kidney Cav1 expression increases as the length on injury increased as shown in Figure 3. There was an error in pipetting in the Western blot for the day 3 wild-type left number 2 mouse, thus appears empty.
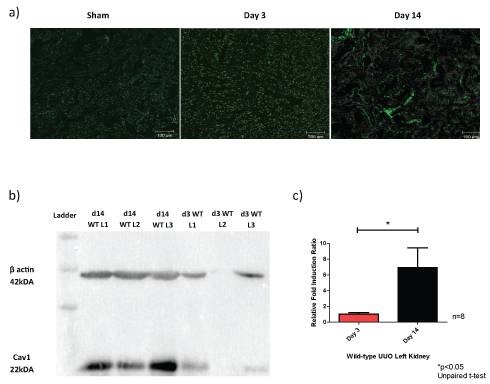 Figure 3: Caveolin-1 expression increases with length of UUO injury at day 3 and day 14. a) Confocal images of the wild-type UUO kidney (× 10 objective of the Zeiss confocal LSM 510 microscope); b) Representative Western blot of the Cav1 protein expression in relation to β actin in the left kidney; c) Relative fold induction ratio to sham for RT-qPCR of Cav1 mRNA.
Abbreviations: Cav1: caveolin-1; d14: day 14; d3: day 3; WT: wild-type; L: left. View Figure 3
As compared to day 3, there is increased mRNA at day 14 for TGFβ-1, collagen 1α1 and collagen 3α1 in the wild-type left UUO injured kidney. The mice also exhibit a weight increase but similar percentage Gomori staining (Figure 4).
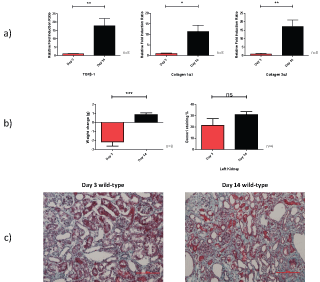 Figure 4: Relative fold induction change of TGFβ-1, collagen 1α1 and collagen 3α1 mRNA; b) Weight change; and c) Gomori stain for day 3 and day 14 injured wild-type UUO kidney.
* = p < 0.05; ** = p < 0.01; *** = p < 0.001. View Figure 4
Confocal microscopy shows an increase in CD31, F4/80 and αSMA positive staining in day 3 and day 14 models as compared to sham operated mice (Figure 5).
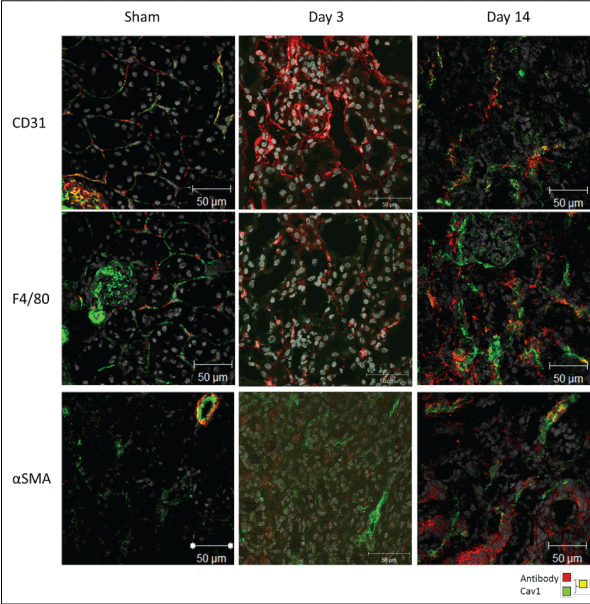 Figure 5: CD31, F4/80 and αSMA confocal staining in wildtype mice in UUO models of fibrosis (× 63 objective of the Zeiss confocal LSM 510 microscope). View Figure 5
Sham operated wild-type and CKO mice did not significantly differ in the fold induction of TGFβ-1, collagen 1α1 or collagen 3α1 (Figure 6).
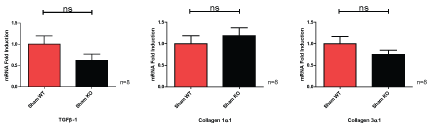 Figure 6: Wild-type (WT) and caveolin-1 knockout (KO) mice sham operated mice show non-significant (ns) mRNA fold induction changes. View Figure 6
The CKO mice show a similar pattern of progressive fibrosis as the UUO model temporally progresses. As the model advances with time, there are significant increases in TGFβ-1, collagen 1α1 and collagen 3α1 fold induction as well as a significant increase in Gomori staining of fibrosis. The CKO mice lose more weight at day 3 than at day 14 time points of the UUO model (Figure 7).
 Figure 7: Relative fold induction ratio, weight change and Gomori staining of knockout left obstructed kidney at day 3 and day 14 of the UUO model.
* = p < 0.05; ** = p < 0.01; *** = p < 0.001.
View Figure 7
Whilst there are significant increases in the mRNA fold induction ratios of TGFβ-1, collagen 1α1 and collagen 3α1, and more weight reduction in the CKO mouse group at day 3, there is an increase in the Gomori fibrosis percentage seen in the wild-type group (Figure 8).
 Figure 8: Relative fold induction ratio, weight change and Gomori staining of left obstructed kidney, comparing wild-type to caveolin-1 knockout at day 3.
* = p < 0.05; ** = p < 0.01; *** = p < 0.001. View Figure 8
Whilst there are significant decreases in the mRNA fold induction ratios of TGFβ-1 and collagen 3α1, and weight reduction in the CKO mouse group at day 14, there is an increase in the Gomori fibrosis percentage seen in the CKO group, which is the opposite seen at day 3 (Figure 9).
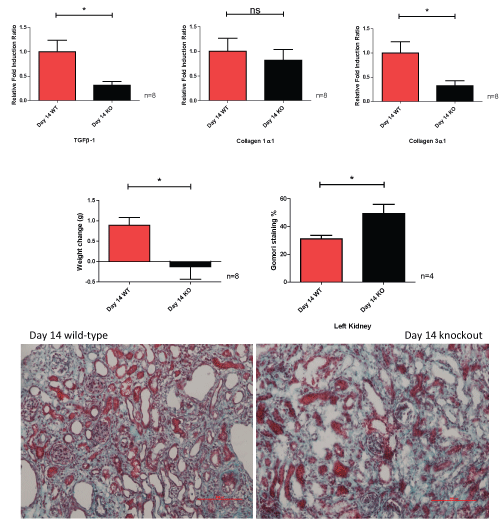 Figure 9: Relative fold induction ratio, weight change and Gomori staining of left obstructed kidney, comparing wild-type to caveolin-1 knockout at day 14.
* = p < 0.05. View Figure 9
The most striking difference with confocal microscopy between wild-type and CKO groups is the amount of F4/80 positive cells staining seen as the model progresses with time. There is a greater number of F4/80 cells staining This staining is more visible in the wild-type than CKO group (Figure 10).
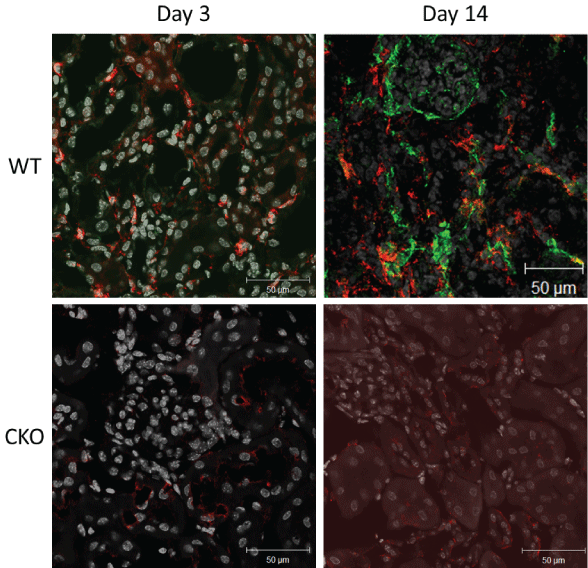 Figure 10: Confocal F4/80 staining in wild-type and caveolin-1 knockout mice. View Figure 10
When comparing the contralateral kidneys, there was over 3-fold induction significant increase in Cav1 mRNA corresponding to the physiological compensation of the right kidney in UUO injury, as well as increased Cav1 protein expression (Figure 11). This highlights that sham operated mice should be used as controls rather than the right kidney in the UUO model of injury. There was a non-significant rise in right kidney Cav1 mRNA between days 3 and 14 of the model (p = 0.51, unpaired t-test).
 Figure 11: a) Comparison of the caveolin-1 fold induction change of the right compensatory kidney in UUO wild-type mice to the left sham operated kidney. One-way ANOVA (top line) to compare difference between groups and post Dunnett's multiple comparison test for day 3 and day 14 to right sham operated kidney; b) Western blot of the wild-type right kidney in UUO. Knockout left kidney included that shows no caveolin-1 protein expression present. View Figure 11
There were non-significant increases in the fold induction ratio changes in the right compensatory kidney between day 3 and day 14 models and wild-type and CKO groups. There were no changes in the Gomori staining of the right kidneys in UUO (Figure 12).
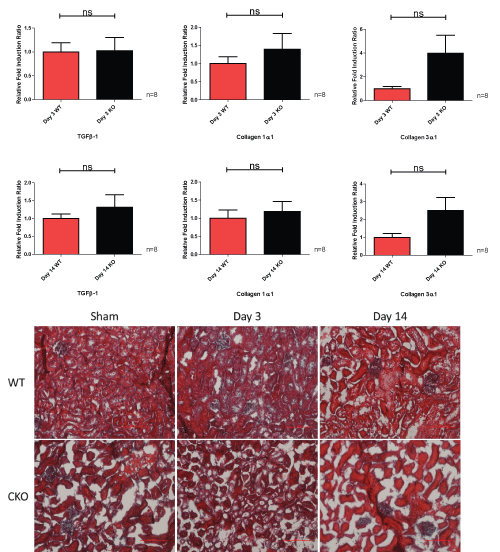 Figure 12: Right compensatory kidneys relative fold induction ratios and Gomori staining at day 3 and day 14 in wild-type and caveolin-1 knockout groups. View Figure 12
From the staining seen on confocal microscopy, caveolin-1 is expressed in the renal endothelium including the glomerular endothelium, vasculature and basolateral aspects of tubules, F4/80 staining positive cells. There was an increase in caveolin-1 expression, whether at a protein or mRNA level, seen in UUO injured wild-type kidney as compared to sham. Cav1 expression was more pronounced the later the UUO injury had occurred. The lack of Cav1 in UUO led to an increased fibrotic phenotype.
After an initial increase in CD31 confocal staining at day 3 of the UUO model (as compared to sham operated mice), there was decrease in CD31 staining by day 14, whilst αSMA staining was increased at day 14 as compared to day 3. This phenomenon has been noted previously in murine UUO and could represent a likely endothelial to mesenchymal transition to myofibroblasts [11].
In the CKO group at day 14 as compared to the day 14 wild-type mice, there was a reduction in TGFβ-1 and collagen I and III mRNA and increased Gomori collagen staining. The fibrotic matrix is rich in fibrillar collagen I and III [12]. This is likely to reflect the established accelerated fibrosis in the CKO day 14 group compared to wild-type. Wild-type Cav1 expression was also increased in the compensatory right non-obstructed kidney as compared to sham at day 3 and day 14. This highlights that the contralateral kidney should not be used as control in the UUO model.
The most striking difference between the wild-type and knockout groups is the F4/80 positive staining cells, which was greater in the wild-type model. Upon cellular injury, extracellular matrix remodelling lead to the release a hetergenous set of molecules called danger associated molecular pattern molecules (such as hylauronan, fibronectin and uromodulin) that trigger sterile inflammation via the innate immune system [13]. They promote polarization of resident and infiltrating macrophages to either M1 (known as classical or pro-inflammatory) or M2 (alternative or regulatory/pro-fibrotic) phenotypes. M1b macrophages predominate during the onset of sterile inflammation [14] and injury with pericyte detachment and vascular rarefaction [15], releasing pro-inflammatory cytokines and reactive oxygen species, exacerbating the initial injury promoting epithelial and endothelial mesenchymal transition via metalloproteinases and degrading the extracellular matrix. M2 macrophages release TGFβ-1, IL-10, VEGF and phagocytose [16]. With Cav1 deletion, macrophages have been shown to have a reduced phagocytic ability after lipopolysaccharide challenge and thus a potential reduced ability to clear apoptotic cells, releasing more inflammatory cytokines [17]. In cardiac models of fibrosis, Cav1 deletion has led to a maladaptive repair process with increased inflammatory molecules as well as more M2 polarized macrophages at an earlier time-point as compared to wild-type [18]. In the CKO UUO group at day 3, the mRNA of TGFβ-1, collagen I and III were all increased suggesting there is more M2 phenotype as well. However by day 14 in the CKO versus wild-type group, the initial M2 'wound' healing macrophage phenotype is maladaptive with substantial remodelling of the interstitium with collagen-based scar tissue as shown by Gomori staining.
The worsening of fibrosis in the CKO day 14 group mirrors the findings of the only published literature of the UUO model of renal fibrosis in Cav1 knockout mice [19]. Park, et al. showed that at day 10 of UUO, there was a reduced surge in mesenchymal stem cells with associated worse fibrosis in the CKO group [19]. Cav1 is required for renal stem cell engraftment as CXCR4 dimerization induced by stromal cell-derived factor-1 occurs in caveolae. It should be noted however Park, et al. has used a different strain for the wild-type compared to the CKO group, thus with different mouse strains have varying susceptibility to fibrosis; this may have affected the changes seen.
The majority of the existing renal in vivo Cav1 research has shown an increased expression with a worse renal phenotype in children with congenital ureteric obstruction [8] and in adult based glomerular disease [9], with authors indicating that Cav1 expression was detrimental. Use of the CKO mouse has shown a protective phenotype in a largely glomerular disease model of diabetic nephropathy using steptozotocin [10], and similar protection in mesangial matrix expansion using pathological light chains [20]. These latter studies serve to highlight that glomerulus is a specialised microenvironment within the kidney where Cav1 expression leads to a worse phenotype, whilst in models of interstitial fibrosis, this study and Park, et al. [19] have shown that Cav1 expression is protective.
The exact timing of increased Cav1 protein or gene expression in a renal disease process either acutely, glomerular based or in reversing fibrosis remains to be elucidated. Future studies should use a conditional knockout to investigate models of renal fibrosis at different time-points to find the optimal timing of any negative effects of Cav1 expression. Non-phosphorylatable Cav1 Y14 has been shown to prevent VEGF-induced RhoA activation and fibronectin upregulation in mesangial cells [21] and future studies may consider the use of this non-phosphorylatable CAV1 Y14 in potentially reducing renal interstitial fibrosis.
In conclusion, Cav1 mRNA and expression on Western blotting is increased at day 3 and further increased day 14 UUO, in line with previous murine and human studies of renal disease and Cav1 expression. However, upon its deletion, this study shows fibrosis worsens at day 14 of the UUO model compared to wild-type.
The UUO model could have been improved by using a conditional knockout mouse to further analyse if the effects seen are as a consequence of direct caveolin deletion rather than an adaptive process of its deletion from birth. The exact timing of increased CAV1 expression in a renal disease process either acutely, glomerular based or in reversing a scarring process remains to be elucidated to an improved renal outcome. Future studies could look to use a conditional knockout to investigate models of renal fibrosis at different time-points to find the optimal timing of any negative effects of Cav1 expression. It would also be more preferable to use a more chronic model of renal fibrosis such as the folic acid model of nephropathy with resulting reduced eGFR and use other models that mimic immune mediated and heavily proteinuric diseases to reflect the diversity seen in human disease. To answer the question of the effects of infiltrating leucocytes into the kidney, bone marrow chimeras of the wild-type and knockout animal can be used in the renal models of fibrosis.
Further analysis of the F4/80 staining could have utilised a semi-quantitative method, but this may be just an arbitrary process to go through. However, future studies should attempt to further characterise the subtype of F4/80 positive staining cells using further staining or indeed flow cytometry for M1 using CD11c and M2 macrophages using CD163/CD206.
Variation of Cav1 expression has the potential in manipulating the renal fibrotic process by altering macrophage number and potentially phenotype, and altering TGFβ-1 expression and the endothelial to mesenchymal transitional process.
All the authors have declared no competing interest. This article does not contain any studies with human participants performed by any of the authors. All procedures performed in this study involving animals were in accordance with the ethical standards of the UK Home office who granted its approval via IRB approval project license number 40/3352 to be conducted at the Biomedical Sciences Unit, Birmingham, UK.