Background: Anthropometric measurements, as opposed to biochemical and clinical indicators, are more sensitive to a broad range of nutritional status since they are directly associated with person’s nutrition, genetic makeup, lifestyle, functionality, and overall health condition.
Objectives: To compare some anthropometric measurements against the short-form of the mini-nutritional assessment tool (MNA-SF); which is a well validated tool for assessing older adults’ nutritional status.
Methods: The cross-sectional study was conducted on 290 patients aged ≥ 60 years who presented at the Family Medicine Clinic of the hospital. The anthropometric indices include; mid-arm, calf, hip, waist, and thigh circumferences, body mass index, body adipose index, waist-hip ratio and waist-height ratio. They were measured using the techniques of the Anthropometric Standardization Reference Manual (ASRM) while the nutritional status was assessed with the MNA-SF. The area under the receiver operating characteristic (ROC) curve was used to assess the predictive ability of anthropometric measurements for malnutrition.
Results: The mean age of respondents was 67.82 ± 7.67 years, with male-female ratio of 1:1.6. This study revealed an excellent area under the curve (AUC ≥ 0.8) for all the measured anthropometric indices in both genders except calf, hip and thigh circumferences in males (AUC 0.78) and body adipose index in both males and females (AUC 0.64 each). The waist-hip ratio (male: β = 7.151, 95%CI = 47.940-98.122, p < 0.001, female: β = 5.982, 95%CI = 49.385-89.189, p < 0.001) had a significant positive coefficient with the nutritional status in both genders.
Conclusion: The anthropometric indices with excellent AUC (≥ 0.8) can be used for the nutritional assessment of the older persons in the primary care setting however, waist-hip ratio (WHR) has the strongest positive prediction of malnutrition.
Anthropometric indices, Nutritional status, Older persons, Northern Nigeria
Data from this study will be useful in developing standard guidelines for the nutritional assessment of the older persons in the primary care settings using anthropometric measurements.
Globally, the population of older persons is increasing, and their well-being is becoming a public health concern [1]. This is because their wellness, illness, and disease states are markedly influenced by the process of ageing [2]. The prevalence of malnutrition is generally high in them and it is one of the most relevant conditions that negatively affect their health [3,4].
Although, there are no universally accepted parameters for defining malnutrition in the elderly because of the variations in the adaptive response to the process of ageing and demographic characteristics [5], some common indicators such as involuntary weight loss, abnormal body mass index (BMI), calf circumference (CC), mid-arm circumference (MAC), thigh circumference (TC), Hip circumference (HC), waist circumference (WC), waist-hip ratio (WHR), specific vitamin deficiencies and dietary intake have been used [6].
Anthropometry has a long history of assessing nutritional and health status of people because their values are directly related to nutrition, genetic makeup, environmental variables, social and cultural conditions, lifestyle, functional status, and health status of an individual [6]. As a result, anthropometric measurements are more sensitive to a wide range of nutritional status than biochemical and clinical indicators, which are only relevant in the most severe cases of malnutrition [7]. Anthropometric examination is also cost-effective, non-invasive, and offers precise information on the various components of body structure, particularly muscle and fat components, making it a perfect approach for measuring the nutritional health of people of all ages [7,8]. It can also be used as indicator for evaluating the prognosis of chronic and acute diseases, and to guide medical intervention in the elderly [8].
Adults with chronic energy insufficiency are typically assessed using BMI, especially in underdeveloped nations. It has a good correlation with body mass estimates for protein, fat, and fat-free mass [9]. The ratio is roughly constant in normal individuals, and a person with a low BMI is underweight and considered undernourished [9]. However, some factors such as oedema, age and cormic index affect the sensitivity and specificity of BMI when used as the sole indicator of nutritional status [10]. The cormic index which is the ratio of sitting height to standing height can influence BMI because it varies within population and between populations [10]. As a result, the nutritional status indicator may be low if the BMI is not corrected using the cormic index. Age may also alter the functional significance of BMI. This is due to the fact that as people become older, they lose fat-free muscle mass and gain fat mass [11]. Because adults can develop oedema when severely undernourished, this will inadvertently boost the individual’s weight, making the BMI appear more normal than it is [2,11]. All of these factors limit the utility of BMI as a reliable screening tool for determining adult nutrition.
Mid arm circumference (MAC) is another important indicator for simple screening of adult nutritional status, specifically in developing countries. It requires little equipment and is simple to conduct even on the most disabled people [12]. It is unaffected by height, however it may be influenced by the redistribution of subcutaneous fat into the body's core parts as people age [12]. Though the MAC category is more effective for classifying under nutrition than the BMI category, there is insufficient data to correlate MAC as the optimal functional measure of adult nutritional status across ethnic and population groups [2,12].
Calf circumference (CC), thigh circumference (TC), hip circumference (HC), waist circumference (WC), waist-hip ratio (WHR), waist-height ratio (WHtR), and weight-height ratio (WtHtR) are also important metrics to consider when it comes to elderly nutrition [13-15]. They have a favorable relationship with nutritional status and can thus be used to monitor the nutritional condition of the elderly [7,15]. However, there is no enough evidence to recommend any of them as the best way to assess geriatric nutrition [7,8,16]. Sex, age and population type can also influence them as they influence other anthropometric parameters [7,8].
In view of the above, a more accurate and population specific method is necessary to assess the nutritional status of the older population using anthropometric measurements. This study is therefore aimed at comparing some selected anthropometric measurements against the short-form of the mini-nutritional assessment tool (MNA-SF); which is a well validated tool and has been shown to have an accuracy of 98% when compared with a comprehensive nutritional assessment, including biochemical tests, anthropometric measurements and dietary assessment [6,15]. This study compares 10 anthropometric indices with the MNA-SF as against BMI, which was used in other studies [7-9]. This is an innovation to the previous literatures and it is envisaged that this will offer a suitable and reliable anthropometric assessment for geriatric nutritional screening in the typical busy and resource-constrained primary care clinics in most developing countries.
The study was carried out in Family Medicine Clinics (FMC) of Aminu Kano Teaching Hospital Kano. Kano is located at the north-western region of Nigeria and the city attracts people from variety of religious, ethnic, and occupational backgrounds. With 20 clinical departments and a capacity for over 800 inpatients care, the hospital functions as a referral hub for neighbouring states and countries. As the primary care unit of the hospital, all patients except emergencies are evaluated, treated or referred to appropriate sub-specialty units of the hospital through the FMC. The medical records of the hospital showed that the FMC sees roughly 35 senior patients every day.
The study population consisted of elderly male and female patients, 60 years and older, who visited the clinic throughout the 12-week study period (1 st November 2022 to 24 th January 2023). The older patients who gave their consent were recruited for the study. The study excluded older patients who had cognitive impairments, scoliosis or kyphosis, confined to wheelchairs, lost some body parts or needed emergency treatment, since they might not cooperate with the study or even affect the accuracy of the anthropometric measurements.
A sample size of 290 was estimated using the formula [17] n = Zα 2 pq/d 2 where; n = minimum sample size, Zα = standard normal deviate corresponding to a 5% level of significance (1.96), P = (25.3%, prevalence rate of malnutrition among older patients attending the FMC of AKTH, Kano Nigeria) [18]. q = 1-p (74.7%); the proportion of the elderly who are not malnourished.
d = level of precision which was set as 5%. Based on similar study [18], the anticipated response rate was 100%. The hospital record revealed an average of 35 elderly patients seen daily in the FMC therefore, the sampling frame was 2,940 (35 × 7 × 12).
Systematic sampling technique was used to recruit 290 older patients attending the hospital, using the sampling frame of 2,940 and sample interval of 10 (2940/290). At registration of each clinic day, a trained research assistant identified all older patients who had completed registration for possible recruitment. The first respondent was selected via balloting on the first day, and then every 10 th older patient who met the inclusion criteria was recruited.
A pretested, interviewer administered semi-structured questionnaire was administered to the respondents to collect data on socio-demographic characteristics which include the age, gender, marital status, ethnicity, religion, literacy level, living condition and occupation.
The anthropometric indices were measured according to the techniques described by the Anthropometric Standardization Reference Manual (ASRM) [19]. The anthropometric measurements were taken twice; once each by the researcher and the research assistant, and the average of the two was taken. The body weight was measured without shoes and with minimum clothing to the nearest 0.1 kg, using a weighing scale manufactured by Seca Corporation ® (Germany). Height was measured in an upright position without shoes and head gear to the nearest 0.1 cm, using a stadiometer manufactured by Seca Corporation ® (Germany). The body mass index [BMI = weight (Kg)/height (m 2 )] was calculated for the subjects and classified according to the WHO classification of obesity [20].
The calf circumference (CC) was measured by wrapping the tape around the widest part of the calf in a sitting position. The participant sat at the table with his or her feet hanging freely. The person taking the measurement stood in front of the participant and measured the maximum circumference of the calf with a fiber-glass tape measure, to the nearest 0.1 cm. The mid-arm circumference (MAC) was measured while the participant is standing upright and the arm is freely hanging by the side. The biceps was measured without applying pressure to the circumference of the most bulging part of the arm into nearest 0.1 cm. The thigh circumference (TC) was measured on the non-dominant leg by wrapping the tape around the thickest part of the thigh. The waist circumference (WC) was measured using the fiber-glass tape measure in standing position with feet and shoulder width displaced apart. The measurement was made in the area between the hip bone and the navel, to the nearest 0.1 cm. The hip circumference (HC) was measured at the widest part of the hips. The largest circumference between the waist and the knees was considered as HC. The waist to height ratio (WHtR), weight to height ratio (WtHtR), waist-hip ratio (WHR), and body adipose index (BAI) were calculated with the appropriate formulae. [BAI = HC (cm)/height (m) 1.5 - 18] [21].
The nutritional status was assessed with the short-form of the Mini Nutritional Assessment (MNA-SF) tool which has 6 items. The assessment score was graded as; malnutrition ≤ 7; at risk of malnutrition 8-11; and well nourished; 12-14 [5]. However, for the purpose of this study, a score of ≤ 7 will be classified as malnourished while > 7 will be normal.
Ethical approval was obtained from the Research Ethical Committee of the Hospital (No. NHREC/28/01/2020/AKTH/EC/3273), on the 13 th April, 2022. Participants discovered to be malnourished during the study received necessary counselling and care.
Data were stored in a pass-worded computer to ensure confidentiality and then collated, coded and analysed using IBM SPSS version 21 software. Absolute numbers and simple percentages were used to describe categorical variables such as sex, tribe and nutritional status. Similarly, quantitative variables (such as age and anthropometric indices) were described using measures of central tendency (mean) and measures of dispersion (range, standard deviation) as appropriate. The Pearson’s chi-square test for categorical variables was used to compare baseline characteristics between normal and malnourished group. The t-test was used to examine the relationship between the anthropometric indices and nutritional status. The area under the ROC (receiver operating characteristic) curve (AUC) was used to assess the predictive ability of anthropometric measurements for the malnutrition (stratified by sex). Linear regression was used to assess the strength and trend of the predictions. A p-value of ≤ 0.05 was considered statistically significant.
This study recruited 290 older persons within the age range of 60 to 95 years and mean of 67.82 ± 7.67 years. Majority (77.2%) of these seniors are in the age group of 60-74 years. They were predominantly females (61.4%), with male to female ratio of 1:1.6. The prevalence of malnutrition with MNA-SF was 19.7%; which was slightly higher among females (10.4%) than males (9.3%).
The important baseline characteristics of the respondents were described in the Table 1, which include age group, sex, religion, marital status, tribe, educational level and occupation. Only the age groups had statistically significant difference (χ 2 = 36.706, p < 0.001) between normal and malnourished groups. Further analysis revealed a moderate negative correlation (r = -0.590, p < 0.001) between age and nutritional status of the respondents. This implies that the nutritional status of the older people worsens with advancing age.
Table 1: Baseline comparison of the normal and malnourished group. View Table 1
Table 2 showed the comparison between the anthropometric indices and nutritional status of the respondents. The mean of the indices was compared between normal and malnourished older persons, and all of anthropometric indices were significantly higher in the malnourished group than normal group.
Table 2: Comparison of anthropometric indices between normal and malnourished group. View Table 2
Table 3 and Figure 1, presented the receiver operating characteristic (ROC) analysis for the area under the curve (AUC) and cut off points of anthropometric indices. An excellent AUC ≥ 0.8 was found in all anthropometric indices of both males and females except CC, HC and TC in males (AUC 0.78) and BAI in both males and females (AUC 0.6). The BMI, WtHtR and WC had the largest AUC in both genders. In males, BMI (0.855, 95% CI = 0.767-0.934), followed by WC (0.852, 95% CI = 0.764-0.941) and WtHtR (0.848, 95% CI = 0.760-0.936) had the largest and excellent AUC, while among females, WtHtR (0.921, 95% CI = 0.853-0.988) followed by BMI (0.911, 95% CI = 0.839-0.948) and WC (0.906, 95% CI = 0.839-0.974) had the largest and outstanding AUC. The least and poor AUCs were found in BAI in both genders: male (0.665, 95% CI = 0.538-0.792) and female (0.641, 95% CI = 0.536-0.746). In general, there were no significant gender differences in the cutoff point for most of the anthropometric indices with varrying sensitivity and specificity except for WC (male = 75.82 cm, female = 63.41 cm), WHR (male = 0.84, female = 0.74), WHtR (male = 45.93, female = 41.99) and BAI (male = 24.54, female = 29.04).
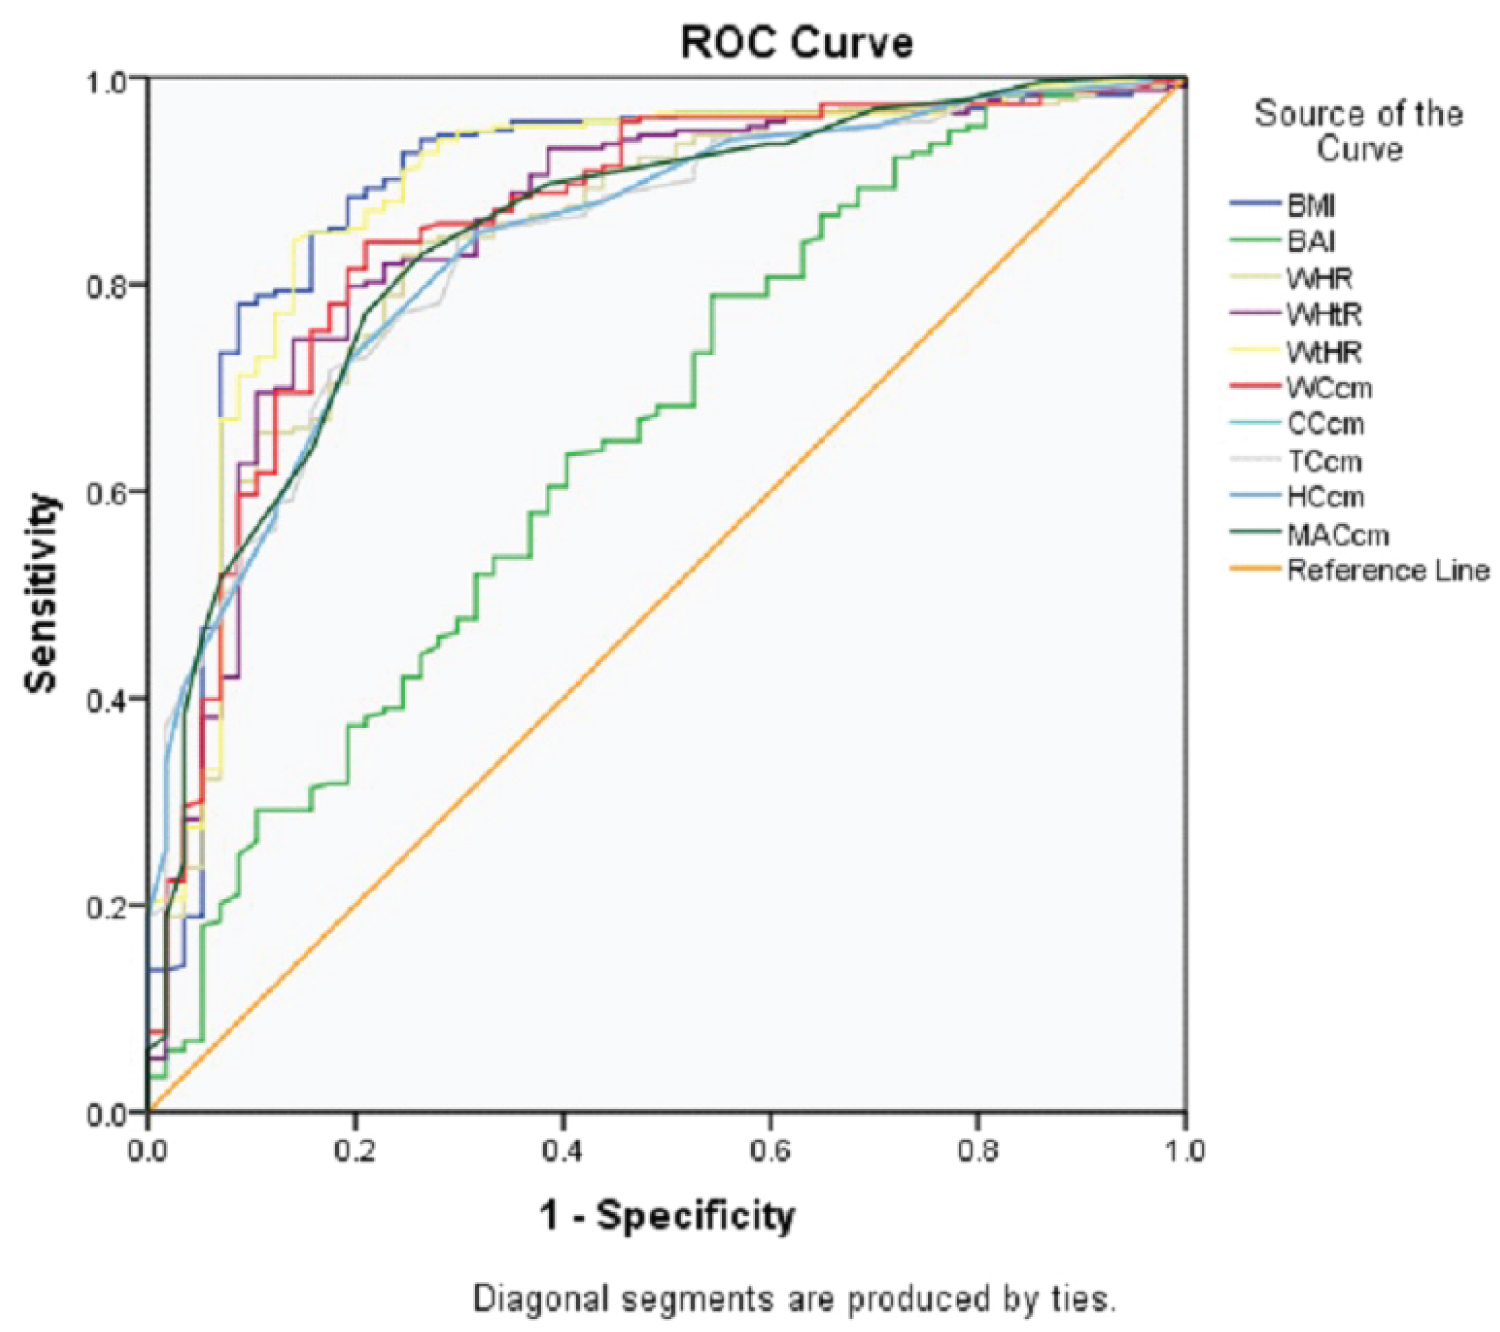 Figure 1: ROC curve of anthropometric indices to predict malnutrition.
View Figure 1
Figure 1: ROC curve of anthropometric indices to predict malnutrition.
View Figure 1
Table 3: ROC analysis of anthropometric indices to predict malnutrition by gender (n = 290: Male = 112, Female = 178). View Table 3
The linear regression model between the nutritional status and the anthropometric indices of the older persons were presented in Table 4. Although, with wide confidence interval, the WHR (male: β = 7.151, 95%CI = 47.940-98.122, p < 0.001, and female: β = 5.982, 95%CI = 49.385-89.189, p < 0.001) had a significant positive coefficient with the nutritional status of both genders. However, WC (β = -12.074, 95%CI = -2.113 - -0.298, p = 0.010), and BAI (β = -0.588, 95%CI = -0.645 - -0.030, p = 0.013) had significant negative coefficient with the nutritional status of the females.
Table 4: Regression analysis of anthropometric indices and nutritional status by gender (n = 290: Male = 112, Female = 178). View Table 4
The anthropometric measurements are non-invasive and inexpensive methods of evaluating nutritional status and their values are closely related to individual’s health status, genetic makeup, environmental factors, socio-cultural and lifestyle characteristics [6]. This study aimed to compare and predict appropriate anthropometric measurement for assessing nutritional status of the older people due to the progressive changes in their body composition as a result of ageing. The current study is one of the few that compared the anthropometric indices against the MNA-SF tool.
The reduction in the nutritional status with advancing age among older adults reported in this study could be attributed to the progressive reduction in the peripheral body tissue, such as lean mass and subcutaneous fat, and the associated feeding problems that occur with ageing [2,5,6].
The prevalence of malnutrition in this study using MNA-SF tool was 19.7%. This is closer to 18% reported by Seid, et al. in systemic review and meta-analysis from 11 African countries [14], but higher than 10.6% reported by Aparecida Leandro-Merhi, et al. in Brazil [22], and lower than 25.3% reported by Olawumi, et al. in Nigeria [18], and 26% reported by Moly, et al. in Kochi, southwest India [23]. These variations in the prevalence of malnutrition could be mainly due to difference in the tools used. This study used short form of the MNA tool (MNA-SF) while others used the full MNA tool.
Our study revealed that the AUC of all anthropometric indices in identifying malnutrition was greater than the acceptable value of 0.7 in both sexes except BAI (AUC 0.6). This is consistent with the findings of Başıbüyük, et al. in Turkey although,they reported lower AUC (0.66) in WHR among females [7]. The BMI and WtHtR had the largest AUC in both genders (female > 0.9 and male > 0.8). This suggests that anthropometric indices that combine weight and height measurement are still the most valid anthropometric measurements in the older adults. Similar finding was reported among patients with type 2 diabetes by Egbe, et al. in Calabar, southern Nigeria [24], and among older adults in the Lake Victoria Basin of East Africaby Cheserek, et al. [25] in India by Sood, et al. [26] and in Brazil by Aparecida Leandro-Merhi, et al. [22].
Contrary to other findings [7,27,28], this study revealed no significant gender differences in the cutoff point for most of the anthropometric indices with varrying sensitivity and specificity except for WC (male = 75.82 cm, female = 63.41 cm), WHR (male = 0.84, female = 0.74), WHtR (male = 45.93, female = 41.99) and BAI (male = 24.54, female = 29.04).
The high cut off of BAI in female as compared to male was due to the significant disparities in body composition between men and women, with women having more body fat [29-31]. Also, the difference in fat distribution with gender, with men having a relatively more central distribution of fat could be reponsible for the higher cut off in male for WC, WHR and WHtR [31,32]. This could also explain why these three anthropometric indices were the three commonest indicators for abdominal obesity [29,32].
Our study revealed that WC, WHR and BAI indices are the independent predictors of malnutrition among the female respondents while WHR was the only predictors in males. It is worthy of note that only WHR has the significant and positive prediction of malnutrition in both sexes. This may be due to the fact that an increase in WC is typically accompanied by an increase in HC, which stabilizes their ratio [32]. Egbe, et al. in Calabar, southern Nigeria, also reported a significant positive linear correlation between WC, WHR and BMI among patients with type 2 diabetes mellitus, where BMI was used as an indicator for nutritional status [24]. Hu, et al. also reported that BMI, WC, and WHtR were independently associated with all-cause mortality among older persons in the Chinese population [33].
The main strengths of this study are the use of systemic random sampling for recruitment and the use of stanadard techniques described by the ASRM for objective measurement of the anthropometric indices. Also, the usage of MNA-SF; which is a more accurate indicator of nutritional status than BMI used in most studies, may help to buildan anthropometric standard for the older population in the primary care centres in Nigeria and other developing countries. The limitation in this study is that variables such as income, physical activity level, morbidities, functional capacity, and cognitive impairments that directly influence changes in body composition over time were not assessed. Additionally, as it was a cross-sectional hospital-based study, care should be taken when interpreting and generalising the outcome.
The anthropometric indices with excellent AUC (≥ 0.8) can be used for the nutritional assessment of older persons in the primary care setting however, waist-hip ratio (WHR) has the strongest positive prediction of malnutrition. Data from this study will be useful in developing an anthropometric standard for the older population in the primary care settings and other related settings.
The study was solely funded by the authors.
We acknowledge our older patients for their cooperation and granting us permission to publish their valuable information. We also thank our research assistants and department’s secretarial staff for making this study a reality.
The authors do not have any conflicts of interest.
Authors’ contribution: Olawumi AL was involved in the conception, design, data collection, analysis, interpretation, manuscript drafting, revision and approval for publication. Haruna AI, Suleiman AK, and Grema BA were involved in design, analysis, interpretation, manuscript drafting, revision and approval for publication. Michael GC, Tanko ST, Riyad M and Aliu R were involved in manuscript drafting, revision and approval for publication.