Background: Lassa fever is an acute viral haemorrhagic fever that affects all major organs of the body including the kidneys. Renal complications of this disease are an important cause of morbidity and mortality in affected patients. Early detection of renal involvement will facilitate the initiation of measures to improve the clinical outcome of such patients as treatment is more effective if initiated early. Ultrasonography is a valuable imaging modality in the evaluation of the kidneys and is useful in assessing early changes in the Kidneys. This study aimed at sonographically evaluating the kidneys in affected patients and correlating findings with serum creatinine.
Material and methods: Eighty subjects comprising forty confirmed Lassa Fever patients and forty healthy adults were evaluated. Grayscale ultrasound measurements of the renal parameters; length, width, depth, volume, cortical thickness, and parenchymal echogenicity were done with a 3.5 MHz probe. Findings were correlated with serum creatinine.
Data was analyzed using Statistical Package for the Social Sciences version 20.0 (SPSS INC II USA). A statistical test was considered significant at p values less than or equal to 0.05 at a 95% confidence interval.
Results: The renal parameters measured were lower in the Lassa fever patients compared to the controls and were statistically significant for length, depth, and cortical thickness. Thirty-seven (92.5%) of Lassa fever patients had increased echogenicity. There was a significant strong positive correlation between serum creatinine and echogenicity (r = 0.731; p = 0.000) in the Lassa fever patients.
Conclusion: Although there was a significant reduction in the renal dimensions, serum creatinine levels correlated more strongly with renal parenchymal echogenicity, thus making it a better predictor of parenchymal damage than the renal dimensions.
Lassa fever, Renal parameters, Ultrasound
Disease epidemics newly emerging and re-emerging infections are of increasing concern worldwide. Lassa fever is an acute viral haemorrhagic fever that is caused by the Lassa virus. It is a zoonotic disease that is transmitted by the rodents Mastomys natalensis , it is endemic in West Africa and the prevalence is estimated at 100,000 to 300,000 with approximately 5,000 deaths occurring yearly [1]. In recent years, outbreaks of known haemorrhagic diseases like Lassa fever and Ebola fever have become major global health issues.
Recent outbreaks in Nigeria with a high mortality rate have become a major challenge to the health sector, it has been reported in many states and some of the states are considered as high risk. Several outbreaks have been recorded in various parts of Nigeria in places like Jos, Abo Mbaise, Ekpoma, Owerri, Onitsha and Lafiya.
Lassa fever is a significant cause of morbidity and mortality. While it is mild or has no observable symptoms in about 80% of people infected with the virus, the remaining 20% may have a severe multisystemic disease [2]. Systemic manifestations include sore throat, retrosternal chest pain, persistent vomiting, abdominal pain, weakness, cough, gastrointestinal bleeding, diarrhea, deafness, shock, coma, and subsequently death. The death rates are particularly high for women in their third trimester of pregnancy with about 95% of the fetuses dying in utero [3].
Renal features seen include proteinuria, haematuria, oliguria, anuria. Acute kidney injury is the most common complication associated with death, elevated serum creatinine levels are also significant findings in Lassa fever cases [4]. People of all ages are susceptible and it occurs in both males and females [2]. Persons at greatest risk are those living in rural areas where the Mastomys natelensis rodent species is usually found. This is especially so in areas of poor sanitation, crowded living conditions, and areas where bush burning is encouraged. Healthcare workers are also at risk if proper barrier nursing and infection control are not maintained. Lassa fever has an incubation period of 6-21 days [2]. Renal complications have been shown to be very common among Lassa fever patients and are associated with increased mortality, hence the need for early detection of those who may be at risk [4]. Proper clinical assessments, laboratory evaluation, and imaging are essential in the diagnosis, management, and follow up of such patients.
Laboratory parameters useful in assessing the kidneys include serum electrolytes, urea, and Creatinine, serum electrolyte is affected by other metabolic conditions, respiratory and gastrointestinal disturbances, and urea is affected by the state of hydration, protein intake, rate of catabolism amongst other factors. Creatinine is a breakdown product of muscle cells which is excreted by the kidneys, although there is criticism of its use, it is still the most widely used method of assessing renal function, and it has been found in many studies to be a good indicator of true glomerular filtration rate in good health [5]. Several studies have been done to determine the normal renal length and varies from 9-12 cm across the different populations [6]. The renal size has been reported as a good marker of renal function, a change in size may be an indication of the loss of kidney mass and hence function [7]. Studies by Yamashita, et al. [8] and Beland, et al. [9] showed cortical thickness to be a strong indicator of renal function and noted that as cortical thickness decreases renal functions are compromised. However, there is a paucity of literature on renal sonographic findings in Lassa fever, especially in our environment. Eze, et al. [10] in a retrospective study on the radiological assessment of acute abdomen in Lassa fever reported increased renal size as well as increased parenchymal echogenicity and loss of corticomedullary differentiation. Okokhere, et al. [4] established strong evidence for intrinsic renal dysfunction in acute Lassa fever rather than from other pre-renal causes such as vomiting and diarrhea. Not much literature is available on the sonographic evaluation of the kidneys in Lassa fever patients in Nigeria. Other viral haemorrhagic fevers have also been reported to show renal involvement, studies by Zehiha, et al. [11] and Augustos, et al. [12] showed increased cortical echogenicity as major findings in patients with Crimean-Congo and Yellow fever respectively. These findings are similar to findings reported in patients with haemorrhagic fever with renal syndrome whose etiologic agents are viruses of the genus Hantavirus of the virus family Bunyavaridae, however only 36% of cases showed increased cortical echogenicity [13].
Several imaging methods are used for evaluating the kidneys. Computed tomography (CT), magnetic resonance imaging (MRI), scintigraphy, excretory urography, and ultrasonography have been used to evaluate the kidneys with varying degrees of accuracy.
Ultrasonography is a valuable imaging modality in the evaluation of the kidneys, being non-invasive, readily available, non-ionizing and can also be carried out at the bedside especially in an emergency setting. It is useful in assessing early changes in the dimensions and parenchymal echogenicity of the kidneys which may be pointers to kidney involvement in affected patients. Early detection of renal involvement will facilitate the initiation of measures to improve the clinical outcome of these cases as treatment is more effective if initiated early. This will lead to a reduction in; morbidity and mortality, longer hospital stays and poor renal outcomes. Furthermore, the health-care burden and cost will be reduced.
This study therefore, aimed to document the pattern and spectrum of renal sonographic findings in Lassa fever and correlate with serum creatinine. It is also hoped that the findings of this study will contribute to the data on the subject of Lassa fever and eventually assist in improved patient management.
This was a comparative cross-sectional study of renal sonographic assessment in Lassa fever and apparently healthy subjects. It was carried out at the Lassa fever isolation ward and Radiology Department of Irrua Specialist Teaching Hospital (ISTH).
The study was carried out amongst 40 confirmed cases of Lassa fever patients admitted to the Lassa fever isolation ward of ISTH. Equal number age and sex-matched apparently healthy volunteers who were randomly selected amongst the staff of ISTH and persons who came for routine medical screening and had no history of febrile illness at least three months preceding this study were studied as controls. The controls also have had no history of contact with any confirmed Lassa fever case three weeks preceding recruitment.
The study was carried out in ISTH, Irrua in Esan Central Local Government Area of Edo State. This area is endemic for Lassa fever.
The Hospital is located about 87 kilometres from Benin City along the Benin/Auchi expressway. ISTH is a federal tertiary institution and a centre of excellence for the management and control of Lassa fever. It receives referrals on suspected Lassa fever cases from within the state and other neighbouring states in the six geopolitical zones of Nigeria.
Esan Central is located on latitude 06’48’ North at an elevation of 1232 feet above sea level and has a humid semi-hot equatorial type of climate with heavy rainfall. The main occupations of the people in the area include farming, hunting, trading, fishing, and animal husbandry. Social and cultural practices in the area encourage the spread of Lassa fever such as the intake of rodent meat and the method of processing the local staple food (garri) made from cassava which is by drying under the sun thus exposing it to contamination from droppings and urine of Mastomys natelensis.
The minimum sample size was calculated using the formula for a qualitative cross-sectional study
n = Z² (p (1 - p) /d²) [14]
Where, n = minimum sample size
Z = 1.96, the value of the standard deviation at a 95% confidence level
p = prevalence of Lassa fever amongst patients in ISTH which was 0.44% [15]
d = degree of precision which was set at 3% or 0.03 thus, the minimum sample size is calculated as;
n = (1.96) 2 ´ (0.0044 (1.00 - 0.0044)/0.03)
3.841 ´ 0.00438/0.09 = 19.00
With an estimated attrition rate of 30%, minimum sample size = 19.00 + (30.00/100.00) ´ 19.00 = 19.00 + 5.70 = 24.70
However, 40 patients and 40 controls were recruited into each of the study groups to expand the scope of the study.
Total sample size = 80 subjects.
Consenting patients with positive Lassa RT-PCR using the primer S36 and LVS 5339 custom-designed by Eurofins, admitted to the Lassa ward within the study period.
1. Patients with known Chronic kidney disease, Hypertension, and Diabetes mellitus
2. Retroviral positive patients
3. Pregnant women
4. Infants
5. Sickle cell disease patients
6. Non-consenting patients
7. Patients with congenital renal malformations such as horseshoe kidneys, crossed fused ectopia, and pancake kidneys.
1. No history of acute febrile illness 3 months preceding the study.
2. Healthy subjects with normal serum creatinine.
1. Known systemic diseases such as hypertension and diabetes mellitus
2. Pregnancy
3. Pre-existing renal pathology
4. Non-consenting subjects
5. Subjects with a recent history of vomiting and diarrhea
6. Subjects with congenital renal malformations such as horseshoe kidneys, crossed fused ectopia, pancake kidneys, etc.
A total of 80 subjects were recruited into this study; 40 of these were confirmed Lassa fever subjects admitted to the Lassa fever isolation ward and 40 equal number age and sex-matched apparently healthy volunteers of which majority were members of staff as well as other individuals who had come for routine medical screening at the ISTH. The procedure was adequately explained to all subjects and written informed consent was obtained from all subjects or their relatives.
Renal ultrasound was performed using two high resolution real-time grayscale ultrasound machines (EDAN-DUS 60, 2011) equipped with 3.5 MHz curvilinear probes; one dedicated to the Lassa ward for examining Lassa fever subjects and the other sited in the ultrasound section of the Radiology department was used for the controls.
Appropriate standard precautions were strictly adhered to by the researcher. This included the use of a protective apron, gloves, goggles, and masks. The examination was performed on patients with empty urinary bladder. Each subject was asked to lie supine on the couch with the abdomen adequately exposed from the upper abdomen to the symphysis pubis. Coupling gel was applied over the upper abdomen, using the liver on the right and spleen on the left as acoustic windows, the transducer was moved along the most lateral edge of the costal margin until the kidney was visualized. The longitudinal and transverse axes of the kidneys were obtained in the supine position. (Supine oblique and prone positions were used when there was poor visualization of the kidneys). The renal parameters obtained include:
1. Renal length (L): Using electronic calipers, the renal length was taken as the longest distance between the renal poles on the longitudinal scan (Figure 1).
 Figure 1: A Transabdominal B mode sonogram (supine) showing a longitudinal section of the right kidney and the point of measurement of renal length from pole to pole as indicated by the + sign and the Anteroposterior Diameter as indicated by the green + sign.
View Figure 1
Figure 1: A Transabdominal B mode sonogram (supine) showing a longitudinal section of the right kidney and the point of measurement of renal length from pole to pole as indicated by the + sign and the Anteroposterior Diameter as indicated by the green + sign.
View Figure 1
2. Renal width (W): The maximum transverse diameter on the transverse scan (Figure 2).
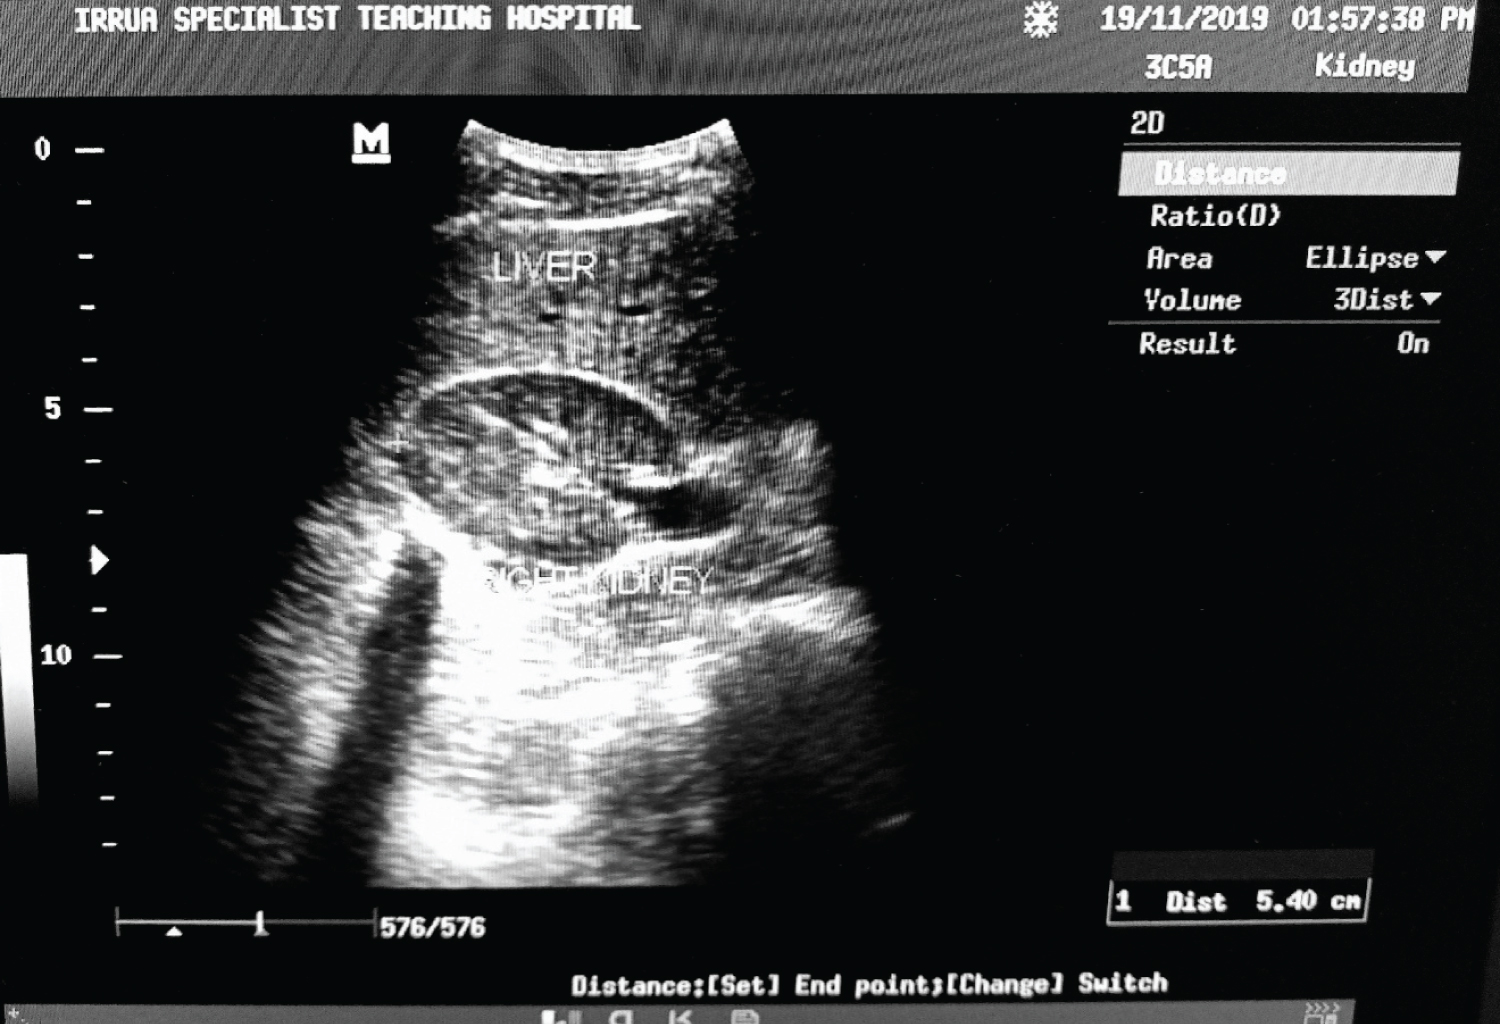 Figure 2: A Transabdominal B mode sonogram (supine) showing a transverse section of the right kidney at the level of the hilum and the point of measurement of width, the widest transverse diameter indicated by the + sign.
View Figure 2
Figure 2: A Transabdominal B mode sonogram (supine) showing a transverse section of the right kidney at the level of the hilum and the point of measurement of width, the widest transverse diameter indicated by the + sign.
View Figure 2
3. Renal thickness (T) - The average of the maximum distance between the anterior and the posterior walls of the mid-portion of the kidney in the longitudinal and the transverse scan (Figure 1 and Figure 2).
4. Cortical echogenicity was assessed using the supine view only and graded as follows [16]
Grade 0- Normal renal cortical echogenicity less than the echogenicity of the liver on the right and spleen on the left.
Grade 1 - Renal cortical echogenicity equal to the echogenicity of the liver on the right and spleen on the left.
Grade 2 - Renal echogenicity greater than echogenicity of the liver on the right and spleen on the left but less than that of the renal sinus echo with preservation of the corticomedullary differentiation.
Grade 3 - Renal cortical echogenicity equal to that of the renal sinus with loss of corticomedullary differentiation.
5. Renal volume was calculated by using ellipsoid formula; (L × W × T × 0.523) [17] (where L = length, W = width and T = thickness)
6. Cortical thickness was measured on a longitudinal scan as the perpendicular distance from the base of the renal pyramid to the renal capsule. Values were obtained in two sites: (i) 2 cm away from the renal poles and (ii) at the mid-portion of the kidney and averaged to reduce intraobserver errors (Figure 3).
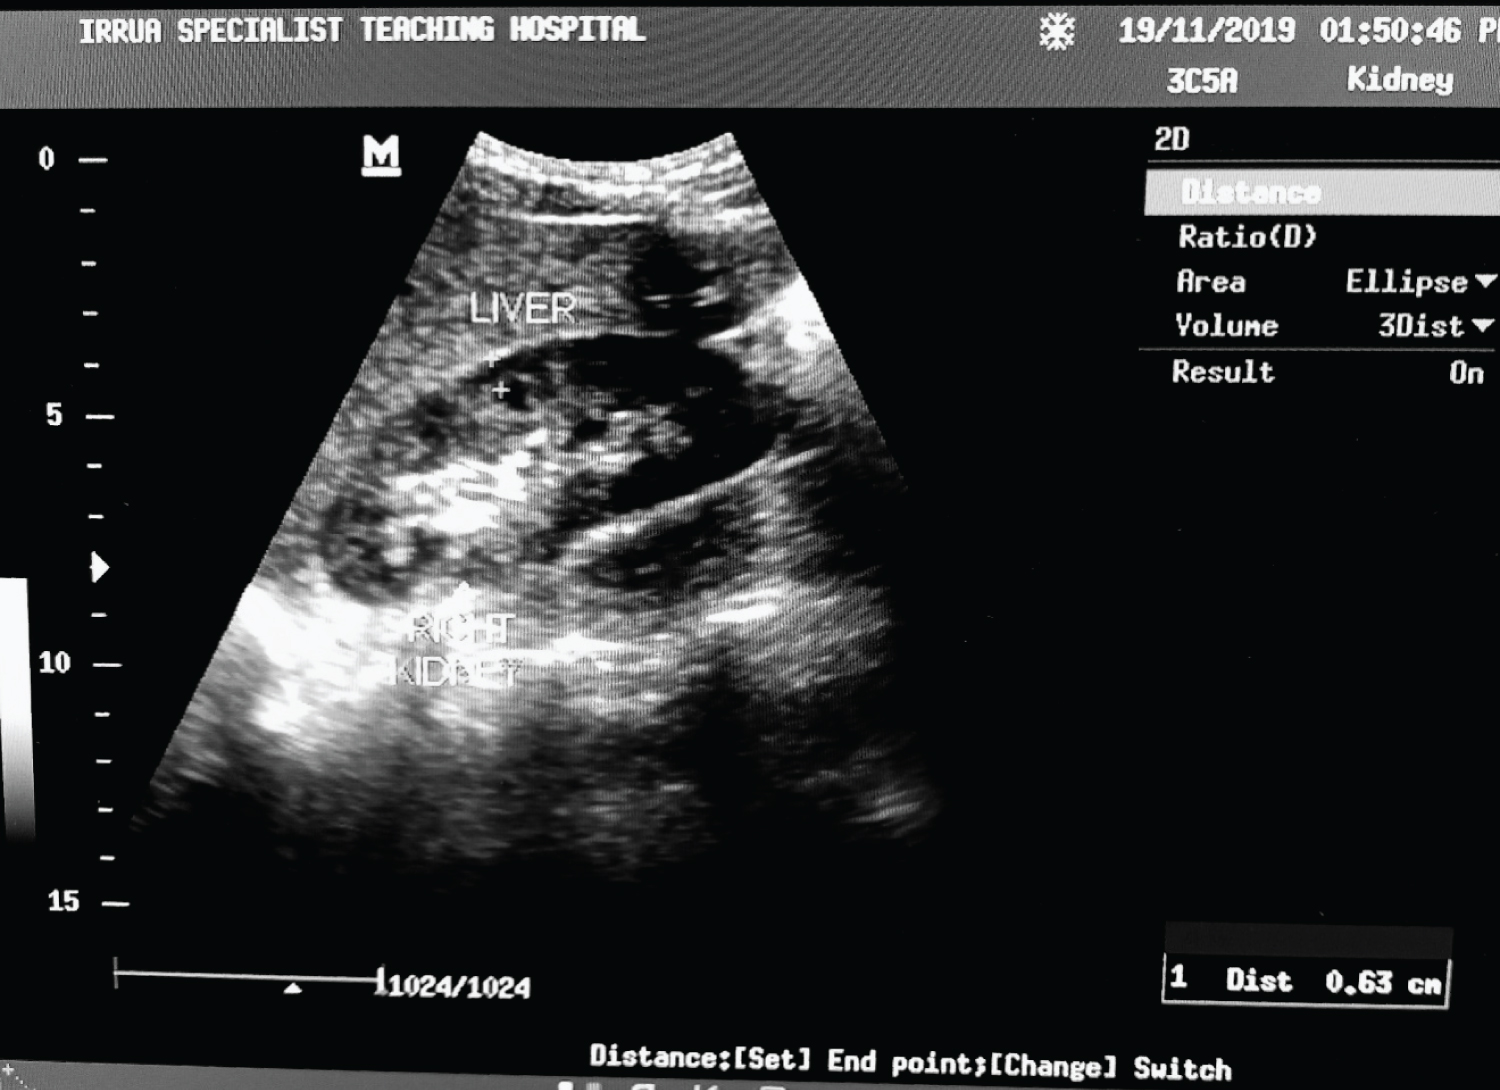 Figure 3: Transabdominal B-mode sonogram along the longitudinal axis showing point of measurement of the cortical thickness from the base of the renal pyramid to the renal capsule as indicated by the + sign.
View Figure 3
Figure 3: Transabdominal B-mode sonogram along the longitudinal axis showing point of measurement of the cortical thickness from the base of the renal pyramid to the renal capsule as indicated by the + sign.
View Figure 3
All ultrasound measurement was taken three times and the average was taken to reduce the intraobserver errors. All measured values were recorded in the datasheet. After the scan, the acoustic gel was gently cleaned off the abdomen using a disposable towel.
The data obtained was recorded in the patient data sheet and stored in a spreadsheet (Excel Microsoft). Subsequent analysis was done using Statistical Package for Social Sciences (SPSS) Windows version 20.0 package. The results were expressed in mean and standard deviation (SD) and presented in the form of tables and charts as appropriate. Data comparison (statistical test of significance) was done using Pearson's correlation analysis, the chi-square test for categorical data, the student t-test, and ANOVA (Analysis of Variance) where applicable. At a 95% interval, two-tailed p values less than or equal to 0.05 were considered significant.
A total of 80 subjects consisting of 40 confirmed Lassa fever patients and an equal number of age and sex-matched apparently healthy adults as controls participated in this study.
Table 1 shows the socio-demographic parameters of the study population which includes age distribution, sex, education, occupation, religion, marital status, and ethnicity. The age range of the study population was from 19-58 years with mean ages of 35.90 ± 9.80 years and 34.80 ± 8.70 years for the Lassa fever patients and controls respectively, the difference in age range was not statistically significant; ( p = 0.598).
Table 1: Socio-demographic characteristics of the Study subjects. View Table 1
The Lassa fever patients comprised of 22 (55.0%) males and 18 (45.0%) females. The controls included 24 (60.0%) males and 16 (40.0%) females, and the male to female ratio was 11:9. However, there was no significant statistical difference in the sex distribution of the study population ( p = 0.651).
More control subjects had tertiary education compared to the Lassa fever patients; 50.0% and 90.0% for the Lassa fever patients and controls respectively, the difference in the level of education between the two study groups was statistically significant ( p = 0.002.). There were more self-employed individuals among the Lassa fever patients; 15(37.5%) while a greater proportion of the controls were civil servants; 23(57.5%), this difference was also statistically significant ( p = 0.000).
The study population was predominantly Christians and the majority were married. The controls were predominately Esan (65.0%) while the Lassa patients had a varied ethnicity. The ethnic distribution was statistically significant ( p = 0.042).
The mean renal length, width, depth, volume, and cortical thickness were compared between the right and left kidneys in both the study subjects and controls (Table 2).
Table 2: Comparison of renal dimensions between the Lassa fever patients and controls. View Table 2
The right and left renal length were significantly lower in the Lassa fever patients compared with the controls (p = 0.021 and p = 0.010).
There was no statistically significant difference in the right and left renal width in both the Lassa fever patients and controls.
Renal depth was statistically significantly lower in the Lassa fever patients compared to the controls (p = 0.024 and p = 0.049) respectively.
Renal volume was lower in the Lassa fever patients compared to the controls. However, the difference was not statistically significant.
There was a statistically significant difference in the right and left cortical thickness in the Lassa fever patients compared to the controls (p = 0.000 and p = 0.000) respectively.
All measured renal parameters were observed to be lower in the Lassa fever patients than in the controls.
Table 3 shows the grades of the renal cortical echogenicity in Lassa fever patients and the control. Only 3 Lassa fever patients had grade 0 which is normal, while most of the Lassa patients had grade 2 renal echogenicity; the higher the grade, the more the severity. There was a statistical significant difference between the renal cortical echogenicity in Lassa fever patients and the control subjects (p = 0.0001).
Table 3: Renal cortical echogenicity in Lassa fever patients and controls. View Table 3
Table 4 compares the serum creatinine level in the Lassa fever patients with that of the controls, this showed the serum creatinine level to be significantly higher in the Lassa fever patients compared to the controls (p = 0.000). Males had a higher serum creatinine level than females (p = 0.030).
Table 4: Mean Serum creatinine for Lassa fever patients and the control subjects. View Table 4
Table 5: Relationship between renal cortical echogenicity (from grade 0-3) and mean serum creatinine levels in Lassa fever patients. View Table 5
Table 6: Relationship between renal cortical echogenicity and the renal dimensions in Lassa fever patients. View Table 6
Table 7: Relationship between mean cortical thickness and renal cortical echogenicity in lassa fever patients. View Table 7
Table 8: Correlation of the renal size dimensions and renal echogenicity with Serum Creatinine in Lassa fever patients and control subjects. View Table 8
Table 5 shows the relationship of serum creatinine with renal cortical echogenicity for Lassa fever patients. Patients with grade 3 renal cortical echogenicity had much higher values of raised creatinine (mean of 6.80 mg/dl) compared to lower values of raised creatinine (mean of 2.10 mg/dl) in patients with grade 1. This shows that as the renal cortical echogenicity increased, the mean serum creatinine levels also increased. The relationship between serum creatinine and the grade of echogenicity was statistically significant ( p = 0.000). A change in the value of serum creatinine per increasing grade of the echogenicity is noted with a marked difference seen from the grade 2 to the grade 3. Figure 4, Figure 5 and Figure 6 show the renal cortical echogenicity grades in Lassa fever patients.
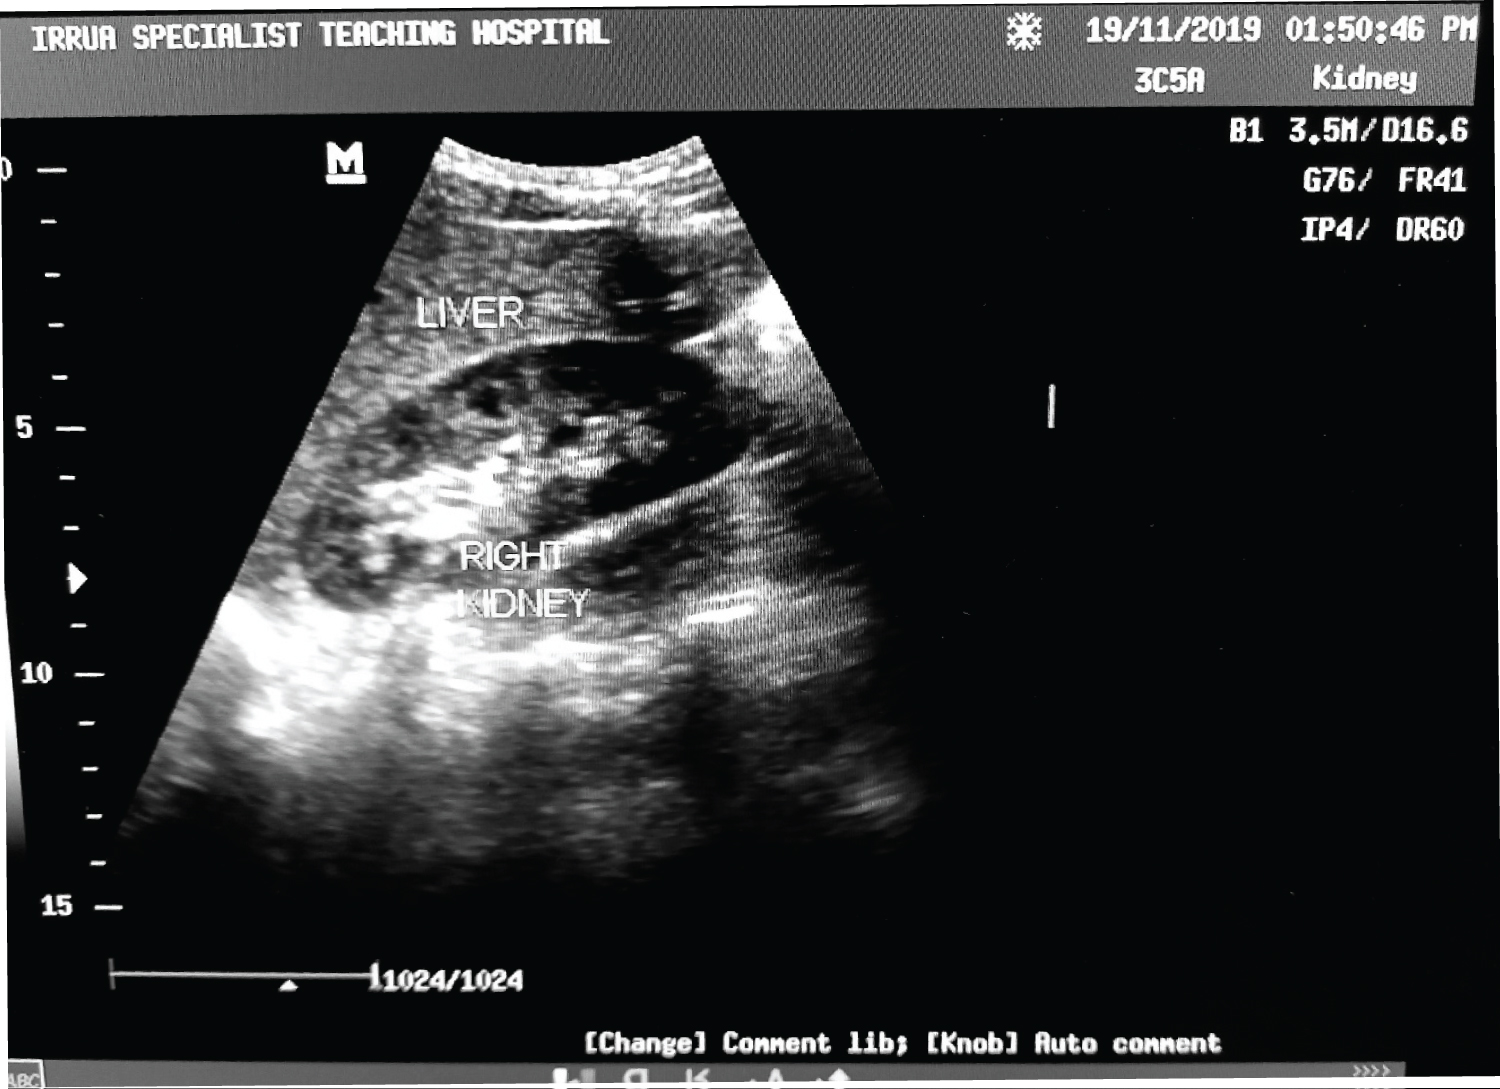 Figure 4: Ultrasound of abdomen showing a longitudinal section of the right kidney with its echogenicity lower than that of the liver (Grade 0 renal cortical echogenicity). Serum creatinine level of 1.0 mg/dl.
View Figure 4
Figure 4: Ultrasound of abdomen showing a longitudinal section of the right kidney with its echogenicity lower than that of the liver (Grade 0 renal cortical echogenicity). Serum creatinine level of 1.0 mg/dl.
View Figure 4
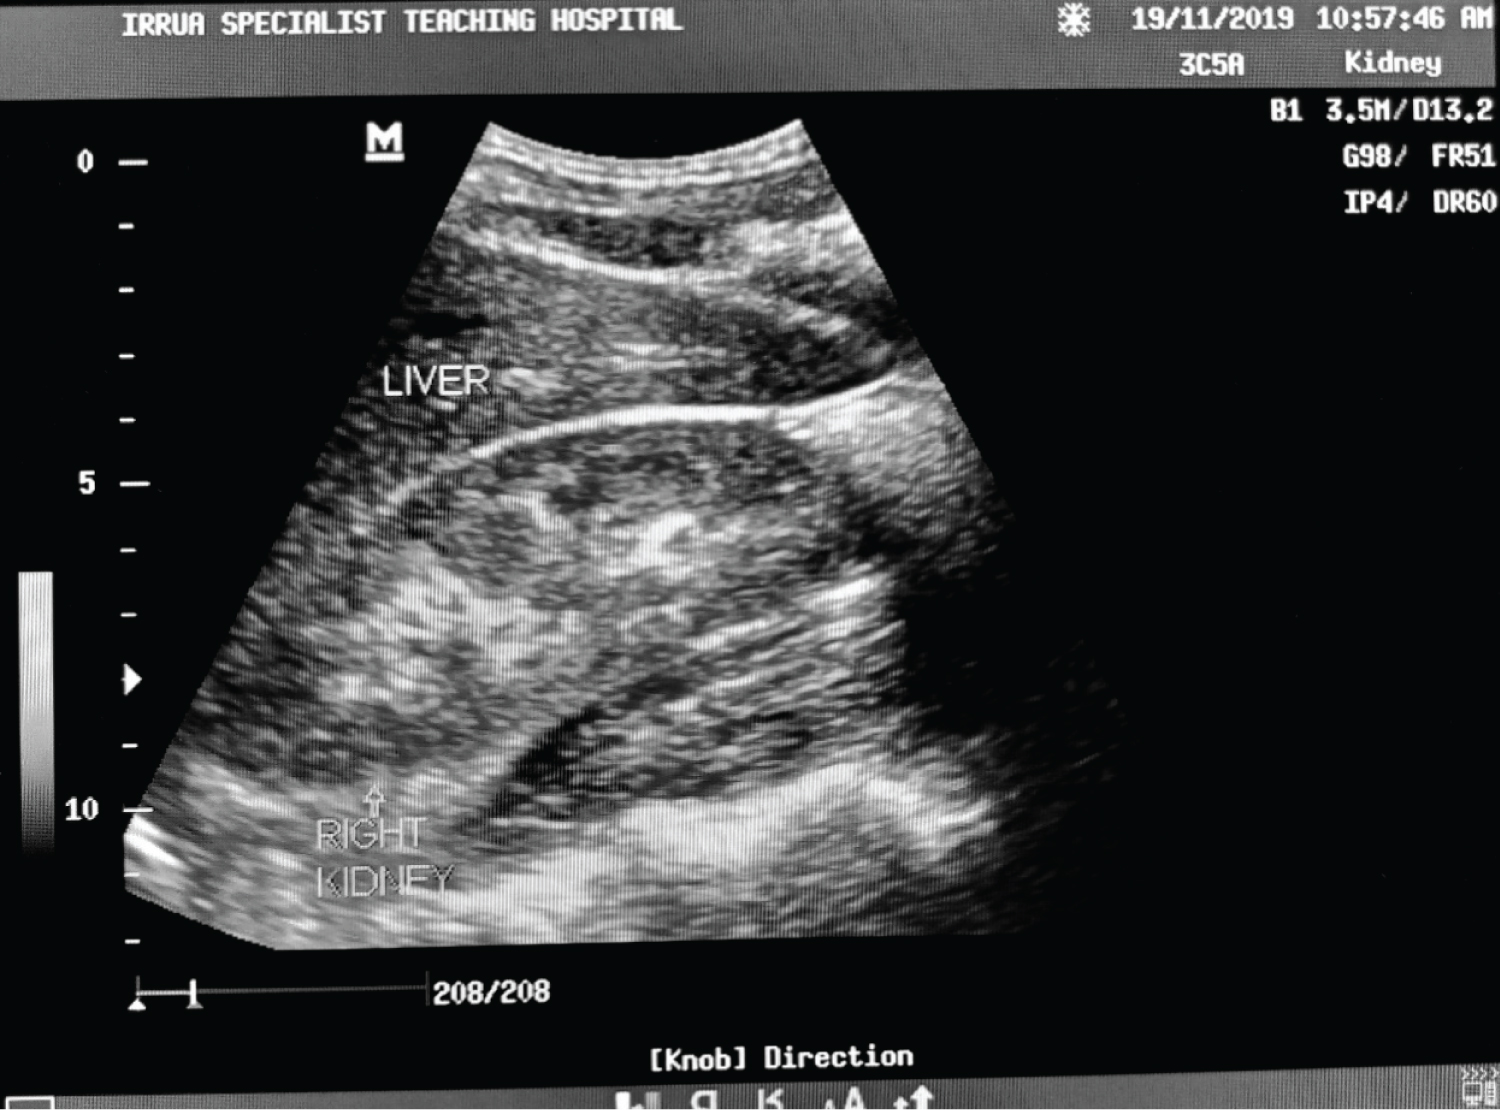 Figure 5: Ultrasound of the abdomen showing longitudinal sections of the right kidney with its echogenicity equal to that of the liver and maintained cortical-medullary differentiation (grade 1 echogenicity) in a Lassa fever patient with serum creatinine level of 1.5 mg/dl.
View Figure 5
Figure 5: Ultrasound of the abdomen showing longitudinal sections of the right kidney with its echogenicity equal to that of the liver and maintained cortical-medullary differentiation (grade 1 echogenicity) in a Lassa fever patient with serum creatinine level of 1.5 mg/dl.
View Figure 5
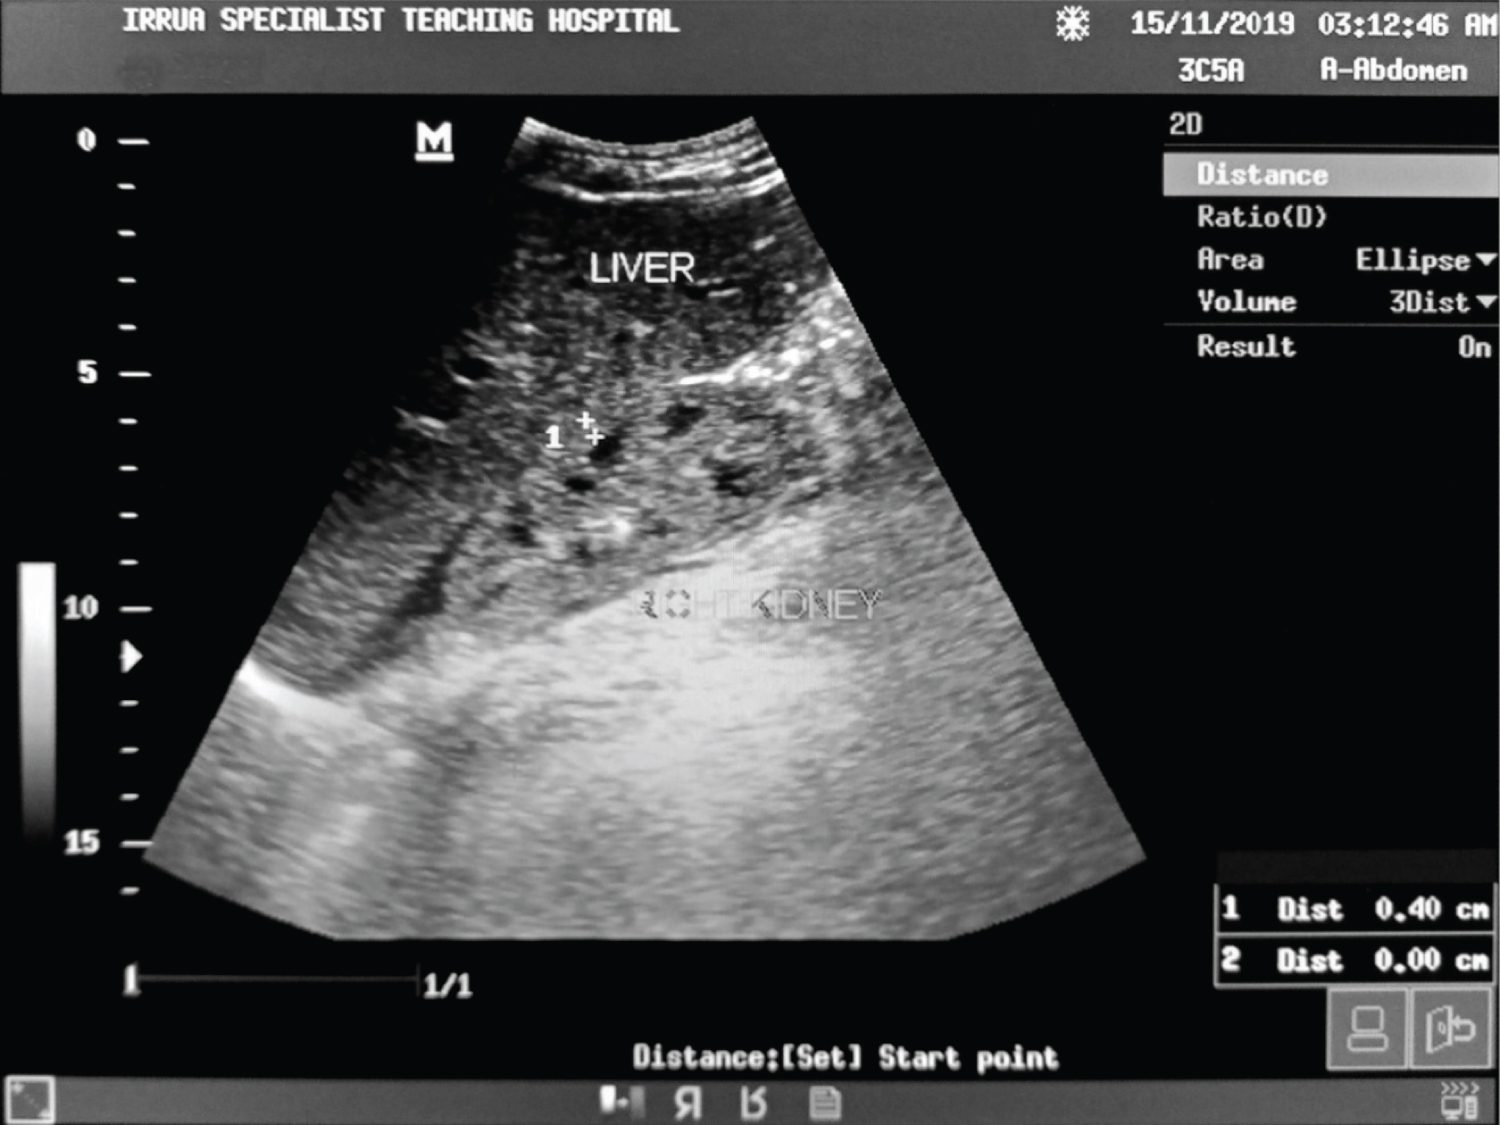 Figure 6: Ultrasound of the abdomen showing longitudinal sections of the right kidney with its echogenicity greater than that of the liver and preserved cortical-medullary differentiation (Grade 2 renal cortical echogenicity) in a Lassa fever patient with reduced cortical thickness and serum creatinine level 2.3 mg/dl.
View Figure 6
Figure 6: Ultrasound of the abdomen showing longitudinal sections of the right kidney with its echogenicity greater than that of the liver and preserved cortical-medullary differentiation (Grade 2 renal cortical echogenicity) in a Lassa fever patient with reduced cortical thickness and serum creatinine level 2.3 mg/dl.
View Figure 6
Table 6 shows the relationship between the renal cortical echogenicity and the renal dimensions. It was observed that at grade 3, all measured renal parameters were lower than those observed in the other grades and these were statistically significant for the mean renal length (p = 0.010), mean renal depth (p = 0.001), mean renal volume (p = 0.029) and the mean cortical thickness (p = 0.0001), this shows that the higher the grade of the cortical echogenicity, the more the severity of renal involvement.
Table 7 shows an inverse relationship between renal echogenicity and mean cortical thickness in the Lassa fever patients. As the grade of echogenicity increases, the cortical thickness decreases. In patients with grade 3, a 100% decrease in cortical thickness was observed. The difference between renal echogenicity and cortical thickness was statistically significant (p = 0.000). The mean cortical thickness was 1.0 cm for Grade 0 (range: 0.7-1.4 cm), 0.9 cm for Grade 1 (range 0.6-1.1 cm), 0.6 cm for Grade 2 (range 0.0-1.2 cm) and 0.0 cm for Grade 3 (range 0.0-0.0 cm) (Figure 7).
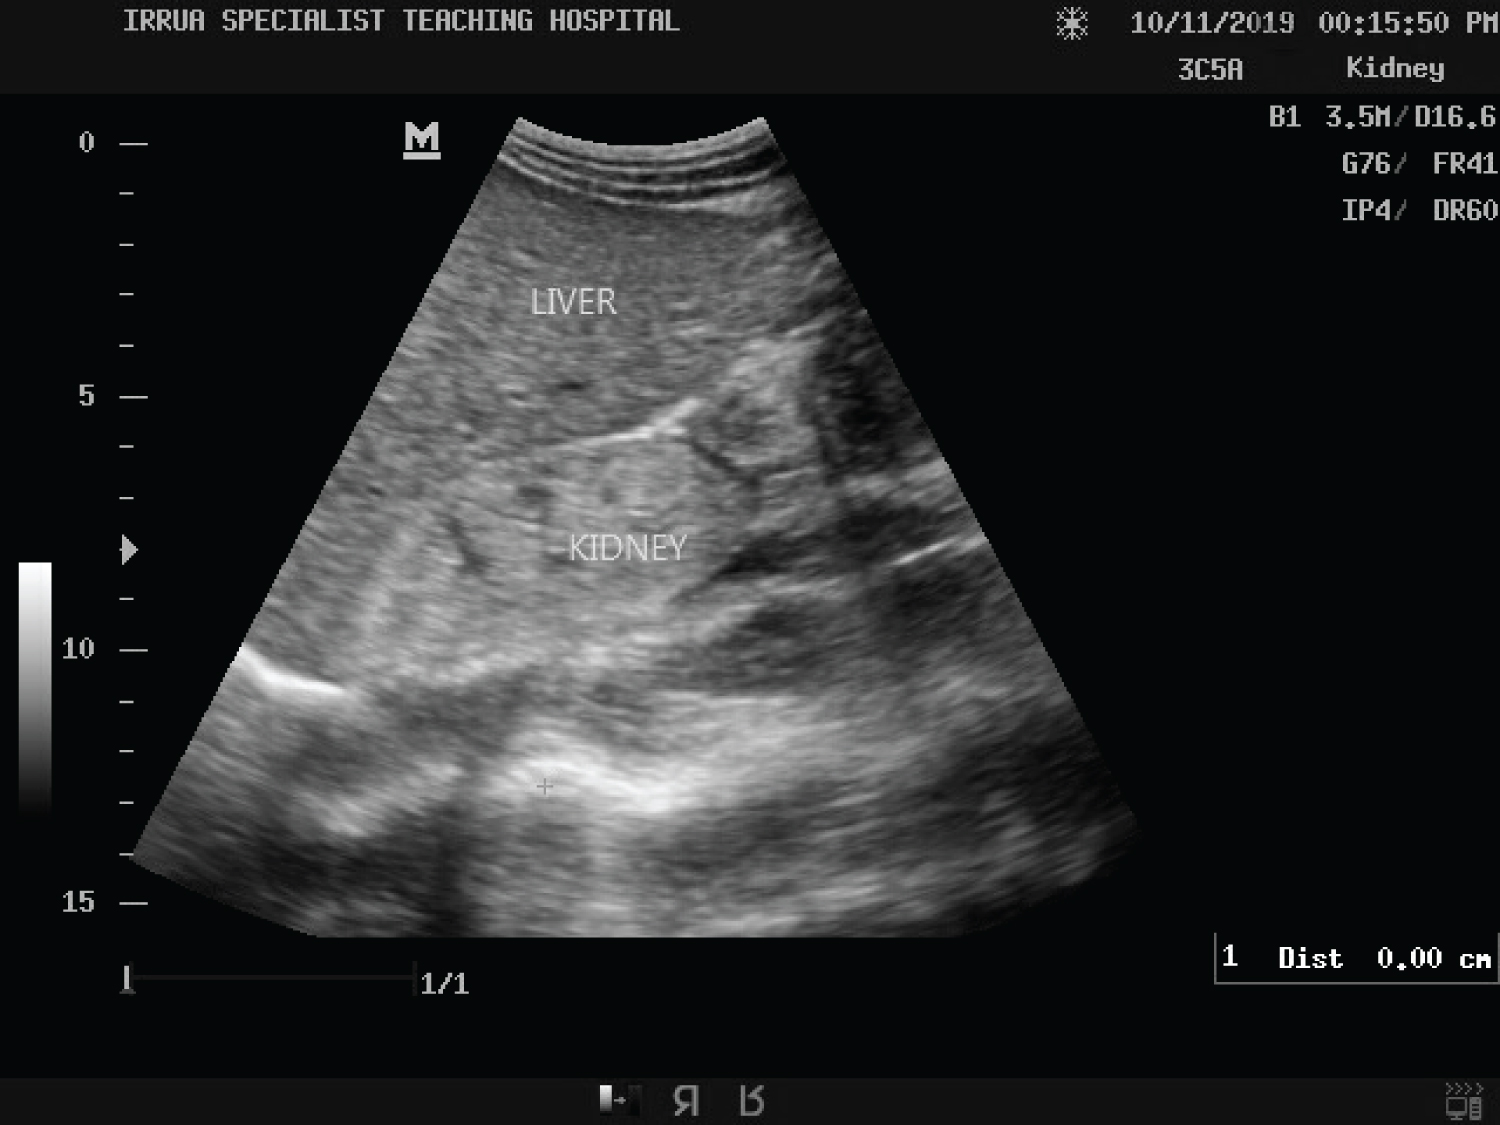 Figure 7: Ultrasound of the abdomen showing longitudinal sections of the right kidney with its echogenicity greater than that of the liver and loss of cortical-medullary differentiation (Grade 3 renal cortical echogenicity) in a Lassa fever patient with serum creatinine level of 3.8 mg/dl.
View Figure 7
Figure 7: Ultrasound of the abdomen showing longitudinal sections of the right kidney with its echogenicity greater than that of the liver and loss of cortical-medullary differentiation (Grade 3 renal cortical echogenicity) in a Lassa fever patient with serum creatinine level of 3.8 mg/dl.
View Figure 7
Table 8 shows the correlation matrix and Figure 8, Figure 9, Figure 10, Figure 11, Figure 12, and Figure 13 show scatter plots for the measured renal parameters in relation to serum creatinine.
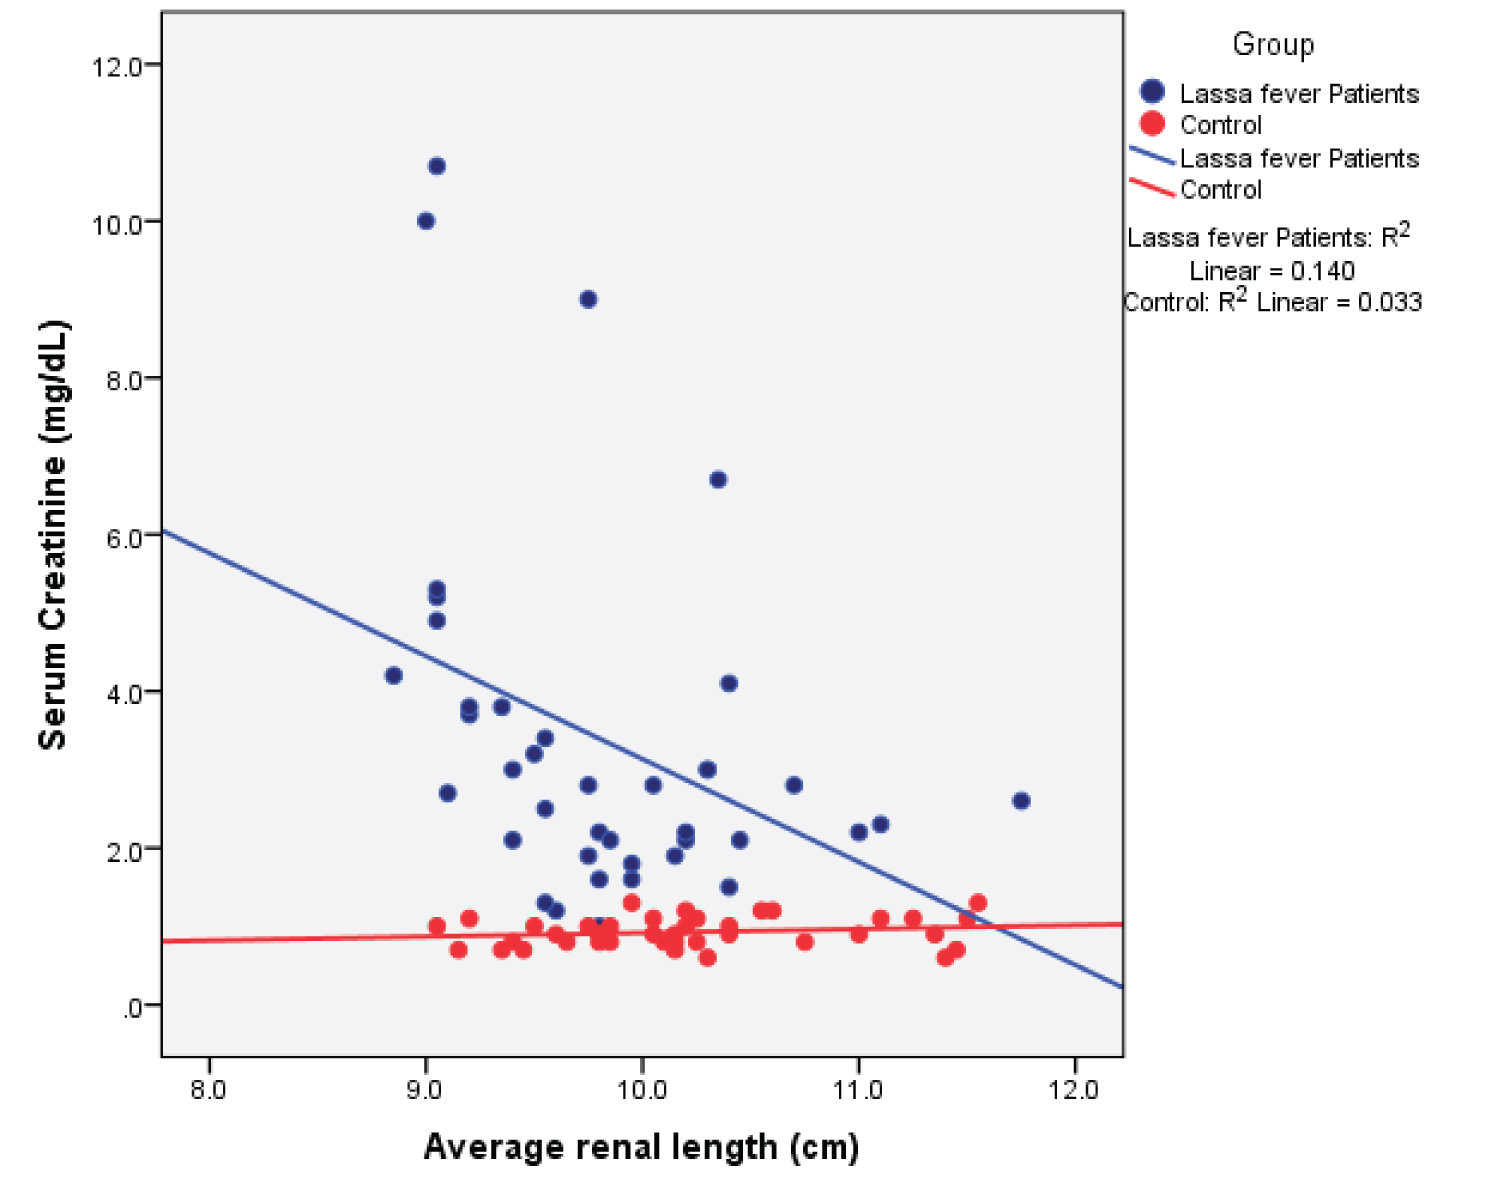 Figure 8: Simple Scatter plot showing the relationship between mean renal length and serum creatinine.
View Figure 8
Figure 8: Simple Scatter plot showing the relationship between mean renal length and serum creatinine.
View Figure 8
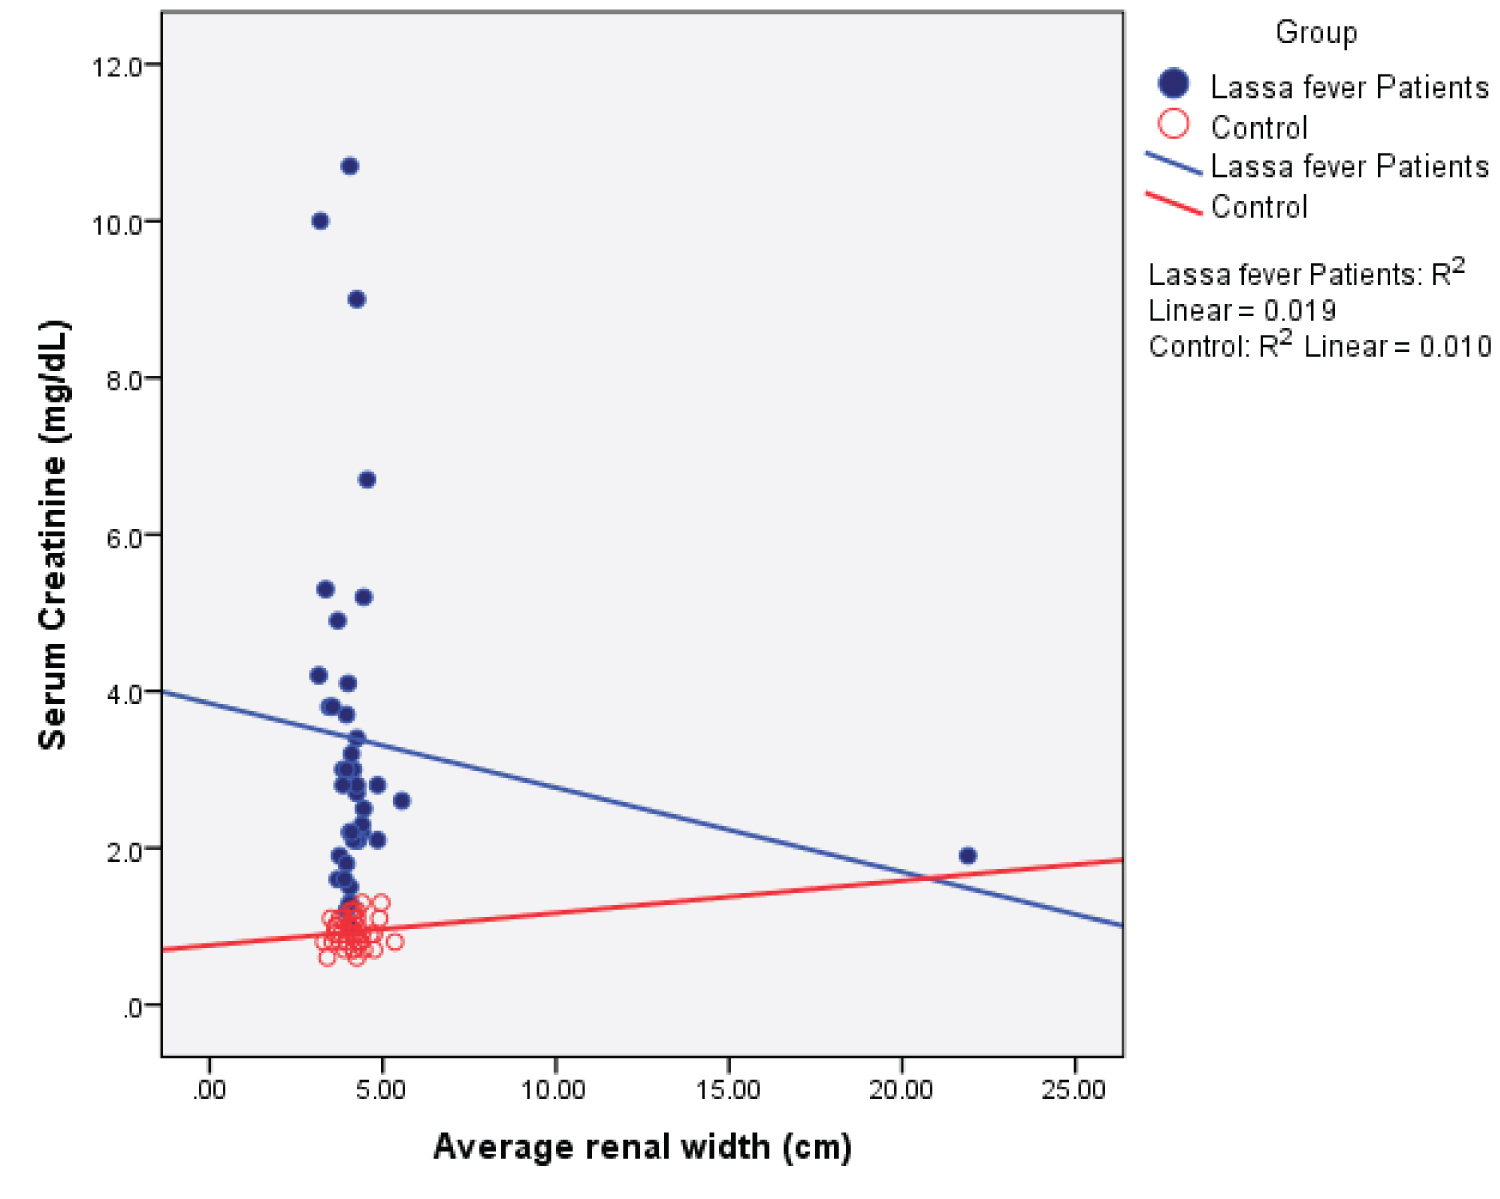 Figure 9: Simple Scatter plot showing the relationship between mean renal width and serum creatinine.
View Figure 9
Figure 9: Simple Scatter plot showing the relationship between mean renal width and serum creatinine.
View Figure 9
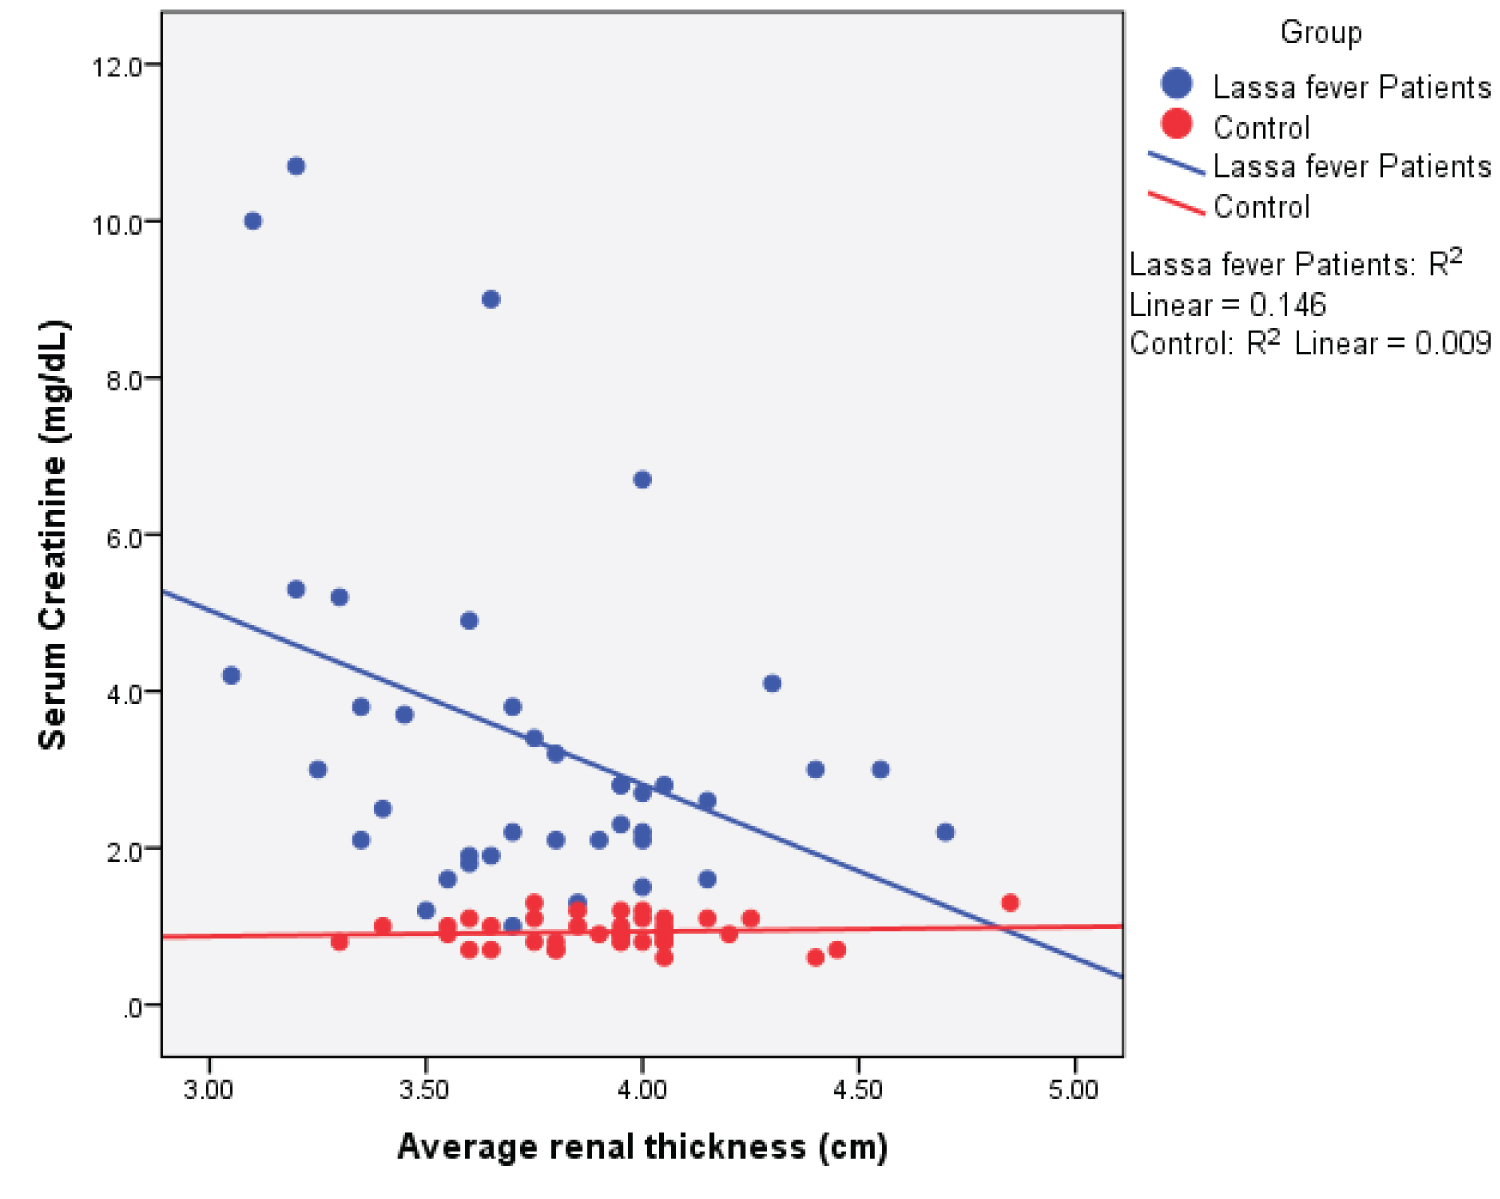 Figure 10: Simple Scatter plot showing the relationship between mean renal thickness and serum creatinine.
View Figure 10
Figure 10: Simple Scatter plot showing the relationship between mean renal thickness and serum creatinine.
View Figure 10
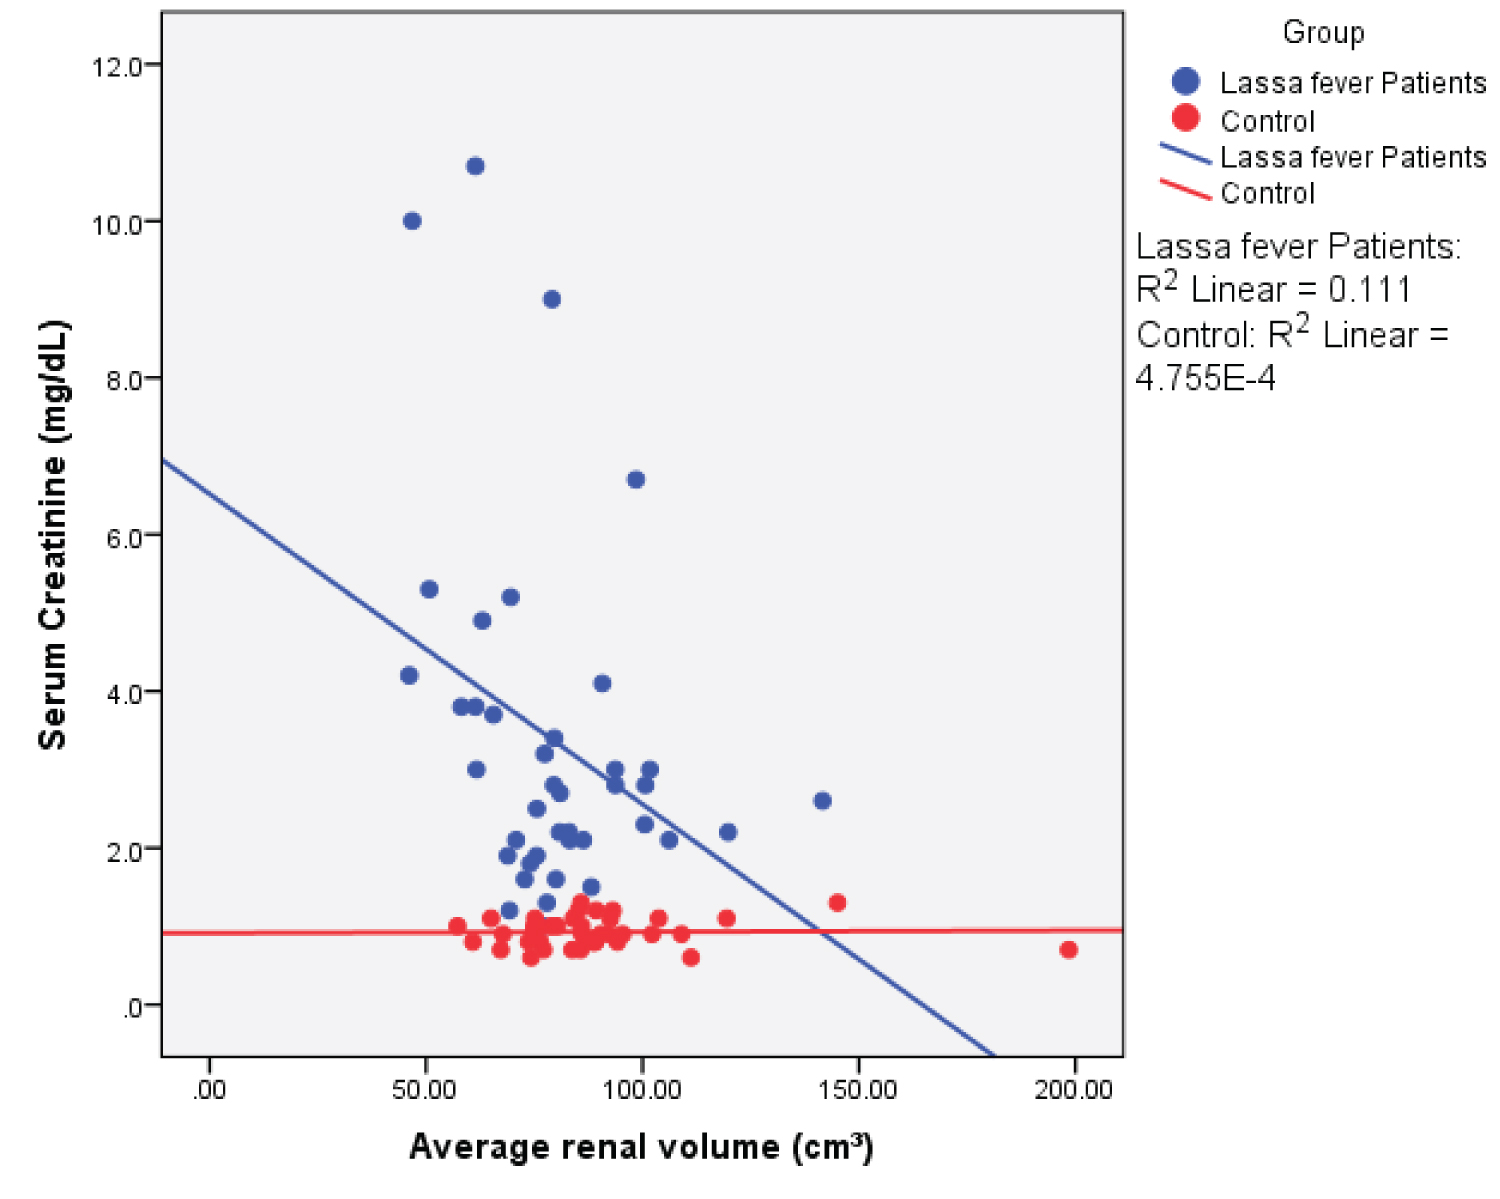 Figure 11: Simple Scatter plot showing the relationship between mean renal volume and serum creatinine.
View Figure 11
Figure 11: Simple Scatter plot showing the relationship between mean renal volume and serum creatinine.
View Figure 11
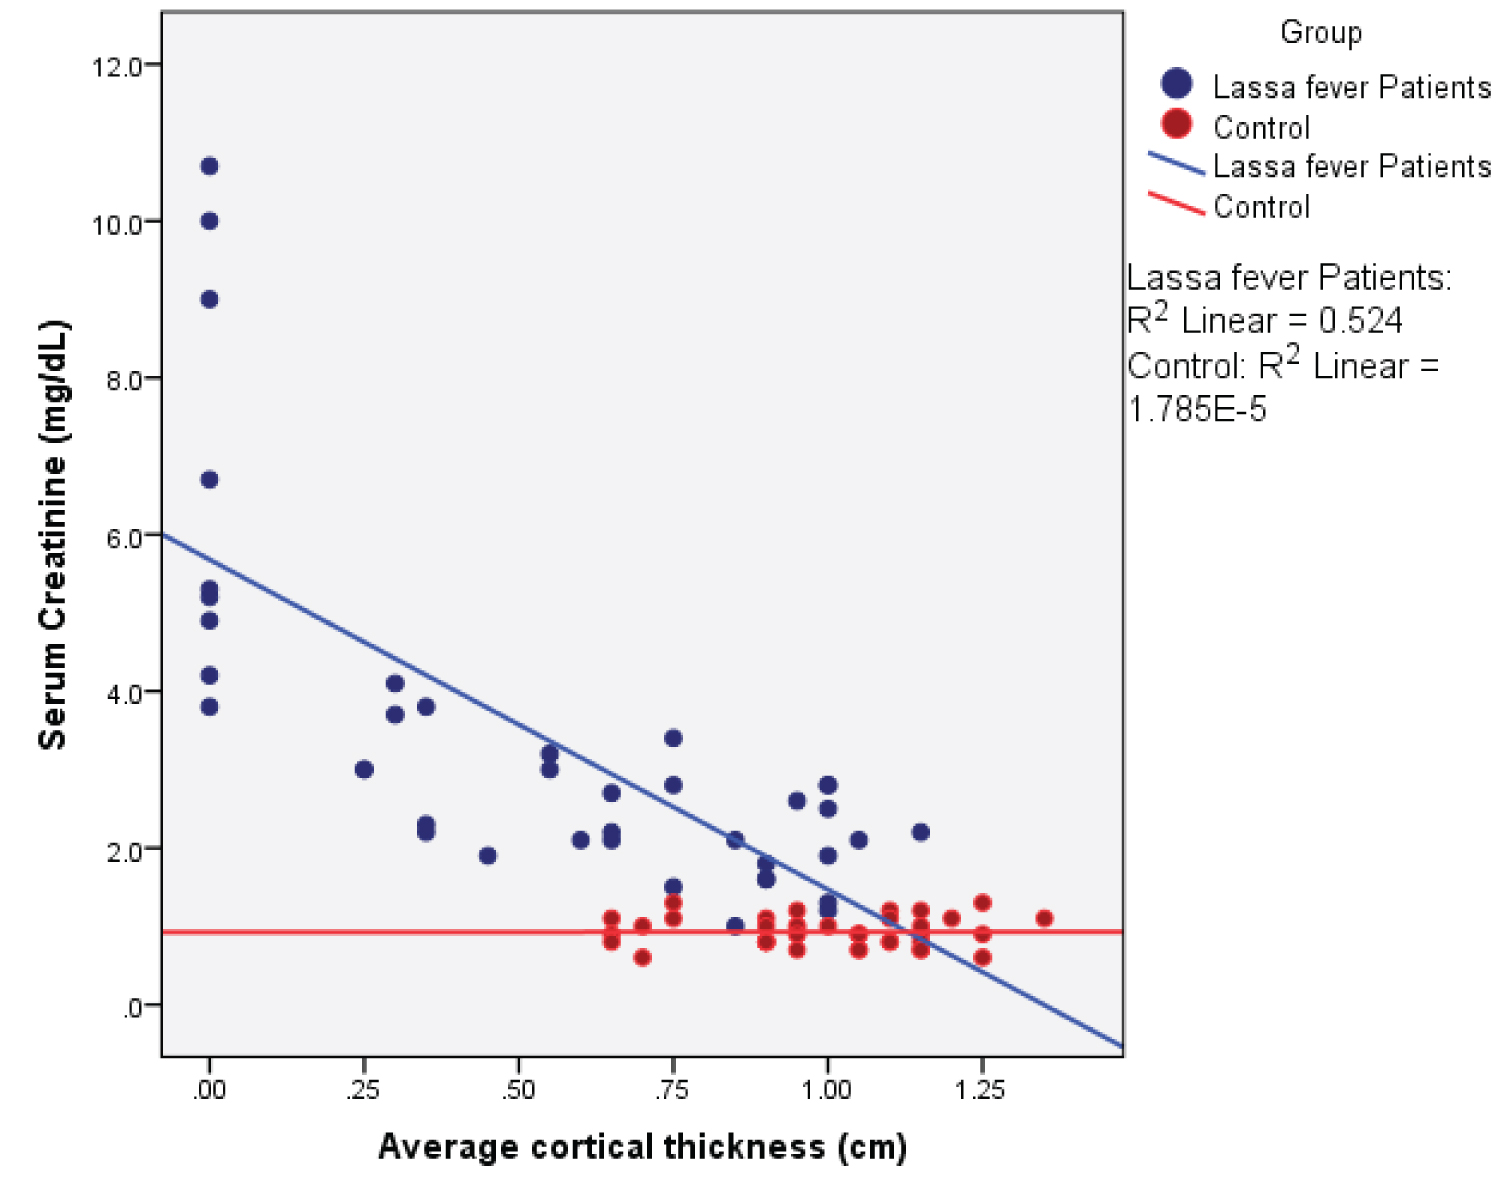 Figure 12: Simple Scatter plot showing the relationship between mean cortical thickness and serum creatinine.
View Figure 12
Figure 12: Simple Scatter plot showing the relationship between mean cortical thickness and serum creatinine.
View Figure 12
 Figure 13: Simple Scatter plot showing the relationship between mean cortical echogenicity and serum creatinine.
View Figure 13
Figure 13: Simple Scatter plot showing the relationship between mean cortical echogenicity and serum creatinine.
View Figure 13
Among the Lassa fever patients, there was a statistical significant weak negative correlation between serum creatinine values and renal length ( r = - 0.374; p = 0.017), renal depth ( r = -0.382; p = 0.015) and renal volume ( r = -0.333; p = 0.036). The cortical thickness however showed a strong negative correlation ( r = -0.724; p = 0.000). A strong positive correlation was seen for the renal cortical echogenicity ( r = 0.731; p = 0.000).
All the renal parameters in the control subjects did not show any statistically significant correlation between serum creatinine.
Lassa fever is an acute haemorrhagic very virulent and contagious viral infection that is associated with increased morbidity and mortality. Renal complications are recognized as one of the major causes of death in affected patients. This study set out to sonographically evaluate the kidneys in Lassa fever patients and to compare findings with Serum Creatinine.
A total of 80 subjects were recruited into this study which comprised 40 confirmed Lassa fever cases and 40 healthy volunteers as controls.
The age range of the study population was 19-58 years with a mean age of 35.9 ± 9.8 years and 34.8 ± 8.7 years for the Lassa fever patients and controls respectively ( p = 0.598) The modal age of the Lassa fever patients was 39-48 years, followed by the 19-28 years age group while the most frequent age in the controls was the age group 29-38 years. In both study populations, the age group 49-58 years was least affected. This shows that those in the active years of life were commonly affected. However, data from other studies on Lassa fever reported that people of all ages are susceptible [2].
Males were more commonly affected by Lassa fever (55%) compared to females (45%), the male-to-female ratio is 11:9. This may probably be due to the fact that males are more involved in jobs like farming, hunting, and animal husbandry which could encourage the spread of the Lassa virus especially in areas of endemicity because the persons at greatest risk are those living in the rural area where Mastomys natalensis species is usually found. However, the difference between the male and female was not statistically significant (p = 0.651). This finding is in agreement with findings from an earlier study in patients with dengue haemorrhagic fever which is caused by an RNA virus and transmitted by the bite of the Aedes aegypti mosquitoes. Males were observed to be more affected compared to females, the reason being attributable to the fact that males were more exposed to outdoor activities than females [17]. In the control group of this study, there were more males than females because more males readily consented than females.
Fifty percent of the Lassa fever patients had tertiary education and the majority were self-employed unlike in the controls where about ninety percent had tertiary education and the majority were civil servants, the difference in the level of education was statistically significant, this may be a pointer to the fact that the level of literacy and awareness as well as the job characteristics may probably have a key role to play in the acquisition of the Lassa fever virus.
The ethnicity of the Lassa fever patients was variable, most of the patients were referrals from neighbouring towns and states while the majority of the controls were Esan, this shows the endemicity of the Lassa virus in Nigeria as the natural host of the Lassa virus Mastomys natalensis is ubiquitous.
The normal renal length varies from 9-12 cm across different populations. The mean renal length in this study for the Lassa fever patients was 9.80 ± 0.70 cm and 9.90 ± 0.60 cm, although within the normal range, this was however lower than that obtained for the controls; 10.10 ± 0.70 cm and. 10.30 ± 0.70 cm for the right and left kidneys. This difference was statistically significant (p = 0.021 and p = 0.010) respectively for the right and left kidneys. A possible explanation for this difference could be that the direct effect of the virus on the renal tissues causes extensive parenchymal damage with subsequent impairment of renal functions which will lead to a gradual decrease in the renal size. To support this, Okokhere, et al. in earlier studies reported that damage to the kidneys in Lassa fever was more of an intrinsic cause rather than from prerenal causes like vomiting and diarrhea. Intrinsic damage will cause a progressive impairment of renal functions [4]. The difference in renal size could also be attributable to the varied ethnicity of the study group as the normal range of renal size is variable and affected by age, gender, ethnicity, weight, and height. In this study, it was observed that the left renal length was longer in both the Lassa fever subjects as well as the controls, the reasons for this longer left renal length being attributable to the impact of the liver indenting its weight on the right kidney and limiting its potential for growth and the shorter renal artery to the left which may allow more nutrient to the left than to the right. Furthermore, no significant difference was seen in the renal length between the male and female in the Lassa fever patients.
The mean renal width in this study was observed to be lower in the Lassa fever patients than that obtained for the controls, the difference was however not statistically significant. Sadisu, et al. [18] in his study reported the mean renal width to be 4.40 ± 0.71 cm and 5.20 ± 5.26 cm for the right and left kidneys respectively and are consistent with values obtained in this study.
A significant reduction in the renal depth of the Lassa fever patients compared to the controls was observed in this study, this suggests that a change in the renal dimensions may have worsened with increasing severity of the Lassa fever illness. Measurement of renal values obtained for the controls was however consistent with findings from normal studies conducted across Nigeria and in international literature. It was also observed in this study that there was no significant statistical difference in the renal measurements amongst the different age groups in both the Lassa fever patients and controls except in the right renal length, right renal depth, right and left cortical thickness, the probable implication of this is that among adults, age and gender do not influence renal measurement. This finding may also be due to the small sample size used in this study. The mean renal volume for Lassa fever patients in this study was 78.00 ± 19.20 cm 3 and 87.10 ± 24.70 cm 3 ( p = 0.068) for the right and left kidneys, this was lower than the values obtained for the controls; 87.10 ± 24.70 cm³ and 91.00 ± 23.70 cm 3 , the difference in renal volume was however not statistically significant ( p = 0.0052). The lower values in the Lassa fever patients in this study may be a reflection of reduced renal function resulting from renal parenchymal damage. Furthermore, volume was observed to be higher in the left kidney both in the Lassa fever patients and controls, The reason could be due to increased blood flow in the left artery which may result in a relative increase in the left renal volume [6]. Sadisu, et al. [18] established normal values for renal volume to be 109.00 ± 29.30 cm 3 and 119.00 ± 32.80 cm 3 for the right and left kidneys in the adult Nigeria population, this mean renal volume was higher than the values obtained in this study, it is possible that the ellipsoid formula used in ultrasound evaluation in this study may have underestimated the renal volume since the kidney is not a true ellipsoid. Although similar to the finding seen in the control group of this study, values obtained are however higher than that obtained in the Lassa fever group, this may be related to differences in the degree of renal impairment in the two study populations, also the larger sample size used in their study could account for some of the differences noted.
Reports from studies conducted on other viral illnesses showed similar findings to data observed in this study; A study conducted at the university of Tampere on radiological findings in Nephropathia Epidermica a viral haemorrhagic fever caused by the Hantavirus, reported a decrease in renal length, renal parenchymal volume as well as cortical thickness in patients studied using magnetic resonance imaging [13]. Although similar to findings seen in Lassa fever, however, values stated are higher than what was obtained in this study, these differences between both study populations may possibly be due to the different imaging modalities used as well as a larger sample size used in their study. Eze, et al. [10] in a retrospective study on Lassa fever patients reported an increase in renal size, this is contrary to findings from the current study.
There was a significant statistical difference in the mean value of the cortical thickness in Lassa fever patients and controls 0.60 ± 0.40 cm vs. 1.00 ± 0.20 cm ( p = 0.000) and 0.60 ± 0.40 cm vs. 1.00 ± 0.20 cm ( p = 0.000) for the right and left kidneys respectively. Reduced cortical thickness was seen in 19(47.5%) of the Lassa fever patients. These findings from this study are in agreement with reports from studies conducted on patients with chronic kidney disease by Yamashita, et al. [8] who reported the average cortical thickness to be 0.68 cm in the upper third (range, 0.38-1.36 cm), their study also emphasized that cortical thickness was a strong indicator of renal function hence a decrease in cortical thickness is an early sign of renal disease and noted that as the cortical thickness decreases, renal function is compromised. These findings are also similar to reports from other studies by Beland, et al. [9] in a Rhode Island hospital who established among patients with chronic kidney disease that cortical thinning was a pointer to an early onset of renal failure. These similar reports were observed in both populations with chronic kidney disease as well as in the Lassa fever study population however suggest that although Lassa fever is an acute disease, changes seen are similar to those of a chronic kidney disease, this possibly could be as a result of the degree of intrinsic parenchymal damage associated with the Lassa virus. Furthermore, in this study, it was observed that as cortical thickness decreased, there was a corresponding increase in renal cortical echogenicity, a fact that further supports the presence of progressive parenchymal damage in Lassa fever disease.
The cortical echogenicity was significantly higher in the Lassa fever patients than in the controls in this study. The difference in cortical echogenicity grading between the two study groups was statistically significant ( p = 0.0001) on the left and right kidneys. 37(92.5%) of the Lassa fever patients had increased cortical echogenicity; only 3(7.5%) had grade 0 which was normal, 11(27.5%) had grade 1, 18(45.0%) had grade 2 and 8(20.0%) had grade 3. The relatively lower number of patients observed with grade 3 echogenicity could most possibly be due to the fact that few patients in this category survive the illness as renal complications have been reported as the commonest cause of death in Lassa fever patients [4]. It was also observed in this study that the renal cortical echogenicity grade 3 was associated with a reduction in all measured renal parameters. These differences were significant for the length (p = 0.010), depth (p = 0.001), volume (p = 0.029), and cortical thickness (p = 0.0001), this shows that the higher the grade of echogenicity, the more the severity of the renal involvement. These are in agreement with reports from studies by Hamper, et al. which showed the degree of increasing echogenicity to be directly proportional to the severity of the disease [19]. The finding of increased echogenicity in this study is also consistent with reports from a retrospective study by Eze, et al. [10] who earlier reported findings of increased renal cortical echogenicity and loss of cortical medullary differentiation in Lassa fever patients.
Not much literature is available on the sonographic evaluation of the kidneys in Lassa fever in Nigeria, however, findings from other viral haemorrhagic fevers have also been reported to show renal involvement. Zehiha, et al. [11] documented findings of increased echogenicity in 40% of patients with Crimean-Congo haemorrhagic fever caused by a tick-borne virus (Nairovirus), likewise 36% of patients with renal syndrome implicated by the Hantavirus of the virus family Bunyavaridae showed increased echogenicity [13]. Similarly, Augusto, et al. [12] reported increased echogenicity in 70% of patients with yellow fever [12]. These reported values are lower than those reported in this study. Sequencing studies have shown that the Lassa virus is highly divergent and more diverse than other haemorrhagic fever-causing virus with a strain variation of up to 32% [19]. The high diversity of the Lassa fever virus might explain the observed variability of clinical manifestation of Lassa fever as well as regional differences. Furthermore, in this study, it was seen that there was no difference in echogenicity between the two kidneys suggesting that the changes seen were bilateral and symmetrical. All control subjects had normal echogenicity.
It was observed in this study that as the cortical echogenicity increased, the mean serum creatinine levels also increased. A statistically significant relationship between serum creatinine and the grade of echogenicity was also observed ( p = 0.000) in the Lassa fever patients A possible explanation for this is that increasing creatinine levels induces more renal parenchymal damage which therefore reflects as increased echogenicity on ultrasound or vice versa. This implies that a direct relationship exists between both variables. The serum creatinine was significantly higher in the Lassa fever subjects compared to the controls ( p = 0.001). Okokhere, et al. [4] reported significantly elevated serum creatinine levels in Lassa fever patients and this is consistent with findings from this study, the high creatinine levels could probably be as a result of the inability of the kidneys to effectively clear the blood of waste product as kidneys function declines, creatinine is less effectively cleared from the blood hence the level rises.
Among the Lassa fever patients, there was a statistically significant weak negative correlation between mean serum creatinine values and renal length ( r = - 0.374; p = 0.017), renal depth ( r = - 0.382; p = 0.015), renal volume ( r = -0.333; p = 0.036) and cortical thickness, this however showed a strong negative correlation ( r = - 0.724; p = 0.000). A strong positive correlation was observed with renal echogenicity ( r = 0.731; p = 0.000). The correlation was however negative and non-significant for renal width ( r = - 0.136; p = 0.401). The implication of this is that in Lassa fever, ultrasonographic findings especially increased echogenicity (highest correlation) can probably be an indicator of the severity of parenchymal damage while awaiting laboratory results.
The renal length, depth, and cortical thickness were significantly lower in the Lassa fever patients compared to the controls, however the observed reduction in the other parameters; width and volume were not statistically significant.
Serum creatinine and the parenchymal echogenicity were significantly higher in the Lassa fever patients compared to controls and showed the strongest correlation than the other renal dimensions. The implication of this is, that increased parenchymal echogenicity may serve as a better predictor of renal parenchymal damage than the renal dimensions.
1) Ultrasonography is operator-dependent; there may be intra-observer variations in measurement. Intra-observer error was minimized by taking the average of three (3) consecutive measurements.
2) The clinical state of some patients hindered adequate cooperation from such a patient.
3) Renal volume measurement based on the ellipsoid formula may underestimate the renal volume.
4) A small sample size and paucity of literature made an adequate comparison with other studies difficult.
1. Ultrasound scan of the kidneys should be routinely done at the point of admission for every suspected case of Lassa fever as abnormalities could be detected early and prompt treatment measures initiated to stop progression and further renal complications.
2. Studies incorporating a larger sample size are recommended to possibly validate some of the findings in this study.
3. Further researches incorporating the use of Doppler studies to assess renal vascular changes are recommended.