End-Stage Kidney Disease (ESKD) has a major effect on global health, both as a direct cause of global morbidity and mortality. Peritoneal Dialysis (PD) utilization increases gradually due to increase of patient's awareness for different types of RRT. Glucose constitutes the main component of the PD fluid utilized by the patients.
In this study, we aim to evaluate the various demography and clinical and laboratory data before and a year after initiation of PD and determine the impact of glucose load and worse metabolic status.
This is an observational study performed at the Royal Hospital, Muscat, Oman. All demographic, clinical and laboratory data were collected prospectively by computerized medical records system called alshifa for patients on PD following at the Renal Medicine Department from on 2015 to 2017.
This study recruited 64 PD patients on PD, 48.4% of them were male and the age mean (SD) was 46.4 (1.1) years. 76.6% were on automated peritoneal dialysis. PD therapy has positive impact on certain laboratory results, but some being affected negatively. Normal hemoglobin level (10-13 g/dl) increased from 47.6% to 78.1% of the patients. Percentage of patients with normal serum calcium improved from 58.7% to 85.2%. Percentage of patients with normal serum phosphate level reached 54.7% compared with 36.5% before PD therapy, normal potassium level increased to 85.9% compared to 58.7% pre-PD, but patients had potassium value less than 3.5 mmol on PD increased to 12.5% from 3.2% pre-PD. On other hand, 87.5% of patients on PD had low serum albumin (< 35 mg) compared with 61.9% pre-PD and normal HBA1C level reduced to 43.5% from 54.1% before starting on PD therapy. High serum triglyceride level increased to 19.4% on PD compared to 15.4% before that, high serum glucose level increased by 1.4% and high serum cholesterol increased by 1.1% on PD.
This study showed improvement of patients' clinical and laboratory parameters over a year period of PD therapy. Most laboratory data and blood pressure reading improved, but there was a negative effect on some of blood investigation level, such as, glycated hemoglobin and serum albumin level.
PD: Peritoneal Dialysis; OS: Observational Study; E: Epidemiology; ESKD: End-Stage Kidney Disease; RRT: Renal Replacement Therapy
The K/DOQI has defined the Chronic Kidney Disease (CKD) as kidney damage or Glomerular Filtration Rate (GFR) < 60 mL/min/1.73 m2 for 3 months or more, irrespective of cause. Kidney damage in many kidney diseases can be ascertained by the presence of albuminuria, defined as albumin-to-creatinine ratio > 30 mg/g in two of three spot urine specimens [1]. Kidney disease has a major effect on global health [2], both as a direct cause of global morbidity and mortality and as an important risk factor for Cardiovascular Disease (CVD) [3]. Cardiovascular Disease (CVD) remains the leading cause of morbidity and mortality in patients with End-Stage Kidney disease (ESKD). CKD is increasingly recognized as a global public health challenge as 10% of the global population is affected [3].
The health system in Oman is quite goods is highly recognized by World Health Organization and other various agencies [4,5]. Through the last four decades, a sharp progression in the prevalence of people progressing to ESKD and demanding Renal Replacement Therapy (RRT) has been noticed in Oman [6-10]. The incidence of patients with kidney disease in Oman who received RRT during 1983 was very low (21 per million populations (PMP) and has been gradually increasing (75 PMP in 2001 and 120 PMP in 2013) [11].
The prevalence of patients with ESKD on RRT in 1983 was 49, which increased to 916 in 2001 and reached 2386 in 2013. By 31 December 2013, there were 2386 patients alive on RRT, of whom 1080 were living with a functioning kidney transplant (45.3%), 1206 were receiving hemodialysis (50.5%), and 100 were undergoing peritoneal dialysis (4.2%) [11]. The World Health Organization ranked Oman on the 51st position of the top world countries where CKD is the most important causes of death and reported that CKD was the 6th major cause of death accounting for 2.97% of total deaths (18.1 per 100 000 population [4-6].
Peritoneal Dialysis (PD) is a readily available simple method for filtration of excess water, clearance of uremic toxins and electrolytes balance. It has been reported to promote improved well-being and greater personal freedom than hemodialysis through less restrictive life-style changes. It has also been argued that PD therapy should be offered to all appropriate ESKD patients and it's a good option for motivated and independent patients [12]. Moreover, Peritoneal Dialysis (PD) as the initial treatment modality in patients with ESKD gives the better preservation of residual renal function and along with its potential cardiovascular benefits. There is a superior patient survival on PD, relative to hemodialysis, as was found during the first 2 years on dialysis in both the United States and Canada. Also, there are the potential advantages of PD in terms of hepatitis C prevention, anemia management and quality of life compared to hemodialysis.
According to the late Dr. Al-Marhuby H. 1998, dialysis services were started in Oman in the form of Intermittent Peritoneal Dialysis (IPD) in AI-Nahdha hospital in the capital Muscat in 1980 [6,11,13]. The first patient treated with Continuous Ambulatory Peritoneal Dialysis (CAPD) was in Royal hospital in 1992. Oman peritoneal dialysis registry in 2016 reported that, the number of patients using this modality had jumped from 60 patients in 2012 to 142 in 2015. Hence, in order to be successful with our PD program, we need to build strong strategies to improve patients' quality of care. It can be initiated by adequate pre-dialysis care, and achieved by proper monitoring of PD quality performance, training and re-training of staff and patients, implementation of international PD guidelines and by medical research and statistical studies to evaluate and improve the provided services.
In this study, we aim to evaluate the various demography and clinical, laboratory data and the impact of glucose load and worse metabolic status before and after initiation of peritoneal dialysis.
This is an observational study performed at the Royal Hospital, Muscat, Oman. All clinical and laboratory data were collected prospectively by computerized medical records system called alshifa. All patients on Peritoneal Dialysis (PD) following the Renal Medicine department and evaluated for peritoneal dialysis as part of their investigations for the period from 1st of January 2015 to the end of December 2017 were included in the study. Patients' data including social data, standard physical examination clinical, radiological and laboratory evaluation were retrieved from the computerized system for all peritoneal dialysis patients. Laboratory investigation and blood pressure measurement collected pre peritoneal dialysis and at one-year post PD management. Serum albumin, glucose, total cholesterol, triglycerides, and lipoprotein (a)/Lp(a)/levels were measured by quantitative kinetic spectrophotometric method using a computerized autoanalyzer AXION (Menheim Boehringer, Germany) and reagents from Boehring diagnostics. CBC, UE1, LFT, Bone, serum glucose and HBA1C were collected. The level of Parathyroid Hormone (PTH) in plasma was measured by RIA method. PCR and urinalysis obtained as well. Data about Peritoneal membranes types were collected too.
Systolic (SBP) divided to systolic Normal (< 120 mmHg ), pre hypertension (120-139 mmHg), stage 1 hypertension (140-159 mmHg), stage 2 hypertension (≥ 160 mmHg) and diastolic BP (mmHg) divided to normal (less than 80 mmHg), pre hypertension (80-89 mmHg), stage 1 hypertension (90-99 mmHg), stage 2 hypertension (≥ 100).
Serum Hemoglobin level was divided into three categories; less than (10 g/dl), (10-13 g/dl) and (> 13 g/dl). Serum Hematocrit level divided into normal (35-45%) and abnormal level. Serum cholesterol level divided to normal level (5 mmoL/L) level, border line cholesterol level (5.2-6.1 mmol/l) high cholesterol (6.2-6.6 mmol/l). Serum Triglyceride level divided to normal level (1.7 mmol.L), border line (1.7-2.2 mmol/L) and high level (˃ 2.2 mmol/L). HBA1C has been classified as Normal, Pre-diabetes (42-47) and diabetic (≥ 48).
Serum albumin level classified to low (< 35g/L), normal level (35 g/dl) and high (> 48 g/L). Serum phosphate level classified to low (< 0.75 mmol/l), normal level (0.75-1.5 mmol/L) and high level (˃ 1.5 mmol/L). Parathyroid Hormone (PTH) level divided to < 65 pg/ml, 65 pg/ml and above 65 pg/ml. Serum glucose divided into three categories, low < 3 mmol/l, normal (3-6.9 mmol/l) and high ˃ 7 mmol/l.
Urine analysis included specific gravity (High ˃ 1.03, Low < 1.02 and Normal (1.02-1.03), urine PH (Acidic < 7, normal 7 and alkaline ˃ 7).
The ages and genders of the dialysis patients were recorded. The heights and weights (dry weights) of the patients were determined by using calibrated height/weight scales. The body mass index of each patient was calculated using the formula weight/ (height)2. The arterial blood pressure of the patients was measured three times on both arms, and the average of the last two measurements was recorded. A desktop sphygmomanometer (Erkameter 3000 with standard mercury) was used to measure the arterial blood pressure. To evaluate the biochemical parameters, venous blood samples were collected after 12 hours of fasting in the morning and before starting dialysis therapy.
Each value expressed as the mean ± SD. P values less than 0.05 considered statistically significant. All statistical calculations performed with the STATA 16 software (version 16.0, STATA Inc, Chicago, Illinois, USA).
There were 64 adult patients on peritoneal dialysis therapy following at Renal Medicine Department, of which 48.4% of them were male and 51.7% were female. Their age ranged between 13 and 80 years with a mean (SD) of 46.4 (1.1) years. Of the total participants, 76.6% were on Automated Peritoneal Dialysis (APD) therapy and 23.4% were on Continues Ambulatory Peritoneal Dialysis (CAPD). The mean (SD) of BMI was 25.4 (6.9) kg/m2, of which 45.3% of patients had normal weight, 15.6% of patients were under weight (< 18 kg/m2) and 39% of them had overweight (˃ 25 kg/m2), as shown in Table 1. 45.3% of total patients took care of PD by themselves and others depended on others. Moreover, out of total PD care givers, there were more than 50% had higher education, Figure 1.
Table 1: Shows the various demographic and participants characteristics. View Table 1
Total of 48.4% of patients were diabetics, 89% were hypertensive, and 46.9% had coronary artery disease. Of the total participants, 46.9% were having other disease in addition to what is stated before. These diseases classified to urology diseases, immune disease, hematology, lung diseases and trauma. Firstly, Urology diseases such as neurogenic bladder, recurrent UTI, obstructive uropathy and Posterior Urethral Valves (PUV), Benign Prostate Hypertrophy (BPH) and kidney stone disease. Secondly, connective tissue disease such as Alport syndrome and lupus nephritis. Thirdly, there were lung diseases, for example, bronchial asthma and TB Lymphadenitis. Fourthly, hematology diseases, such as sickle cell disease and chronic anemia. Finally, trauma was reported such as leg fracture and hip fracture, Table 1.
Kidney Ultrasound Graph (USG) recorded right and left kidney length. There were 62.5% of total patients had small right kidney (< 9 cm), 31.1% had normal right kidney size (9-14 cm) and 6.4% of them their right kidney was enlarged (˃ 14 cm), while 55.1% of participants had small left kidney, 38.8% had normal length, 2.1% had enlarged left kidney and 4% their left kidney was absent, Figure 2.
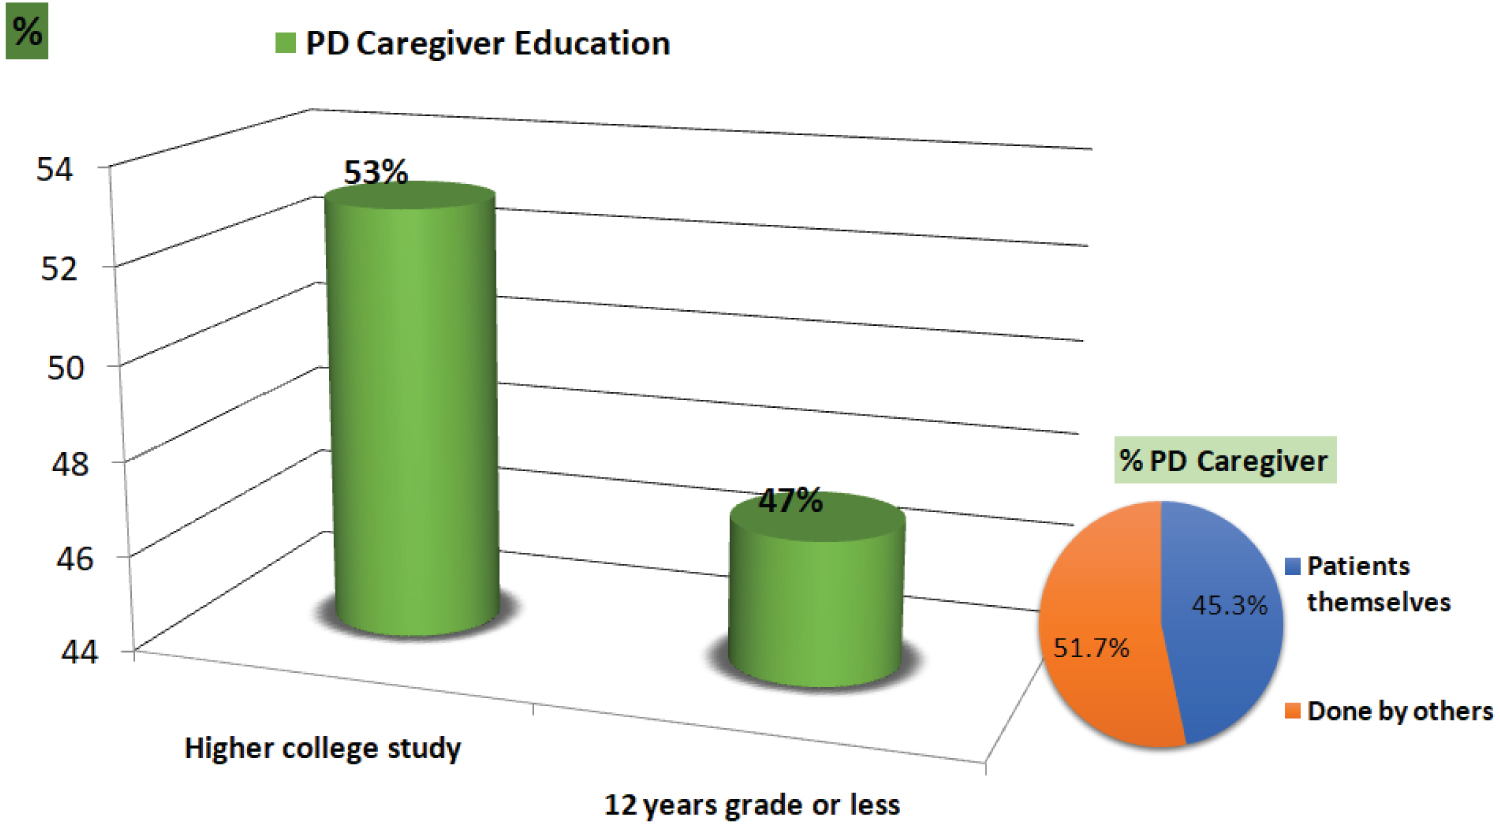 Figure 1: Shows the percentage of patients who perform dialysis themselves and those require caregiver help to perform the dialysis therapy and their education level.
View Figure 1
Figure 1: Shows the percentage of patients who perform dialysis themselves and those require caregiver help to perform the dialysis therapy and their education level.
View Figure 1
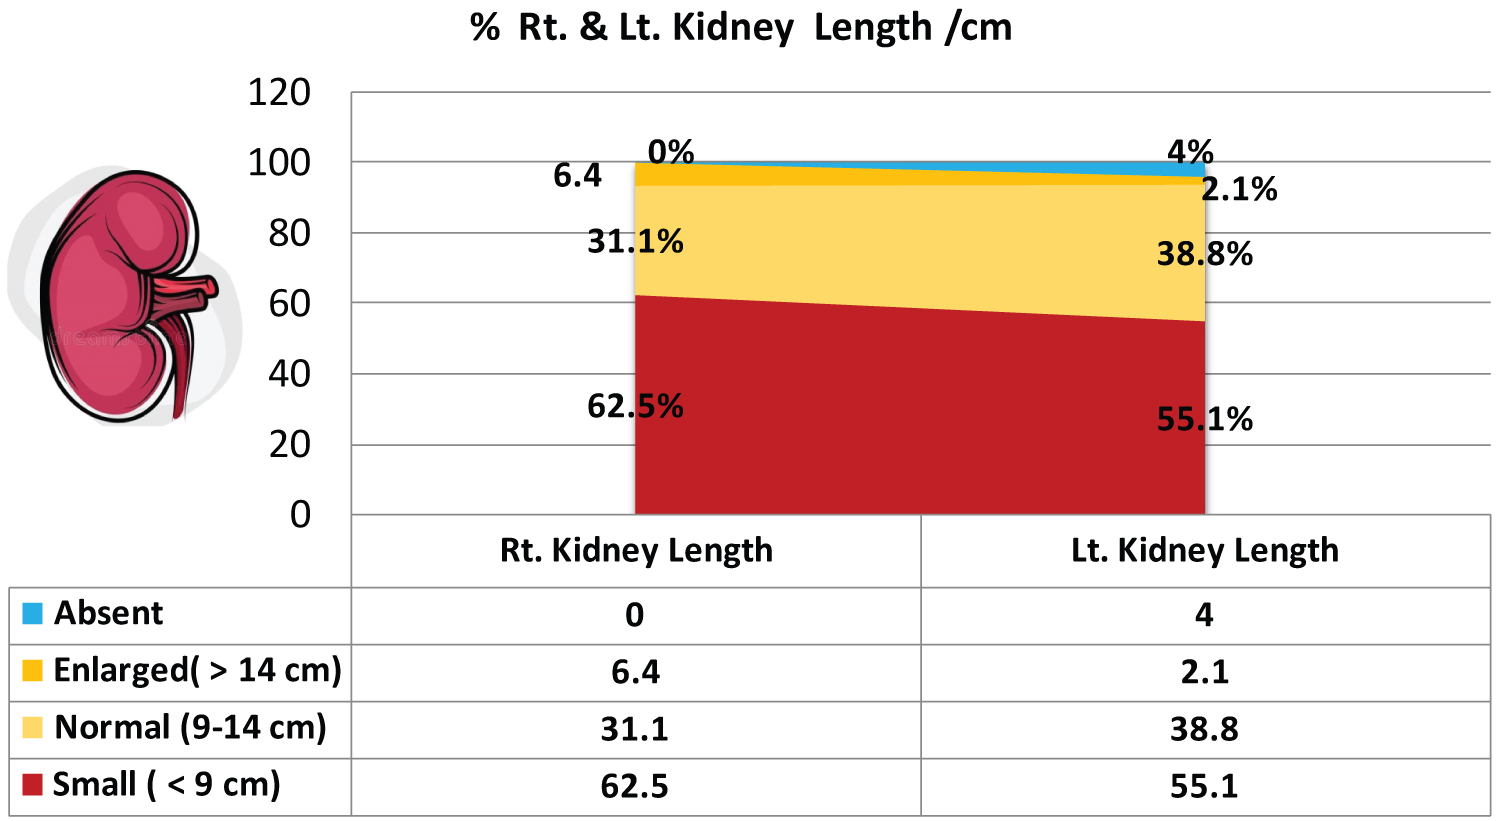 Figure 2: Shows the ultrasound measurements of kidney length.
View Figure 2
Figure 2: Shows the ultrasound measurements of kidney length.
View Figure 2
The percentage of patients started PD as preemptive therapy was 37.5%, 13.7% of them were temporary started on hemodialysis, 6.3% had failed kidney transplantation graft and 45.3% were on permanent hemodialysis and moved to PD mostly due to vascular access failure.
The majority (40.4%) of patients were having high average membrane, followed by Low Average, low and high membrane-transporter, with a percentage of 38.5%, 11.5%, and 9.6%, respectively. PD Catheter (PDC) survival was calculated per years with the highest percentage (70.3%) had PDC for 3-5 years, 37.5% from 1 to 3 years and 21.9% of patients spent more than 5 years on PD.
Figure 3 showed the 24 hrs urine collection for volume measurement/ml classified to three categories > 500 ml/day, 100-500 ml/day and < 100 ml/day. There were 13 (64) patients their 24 hrs urine collection more than 500 ml, 28 (64) less than 500 ml and 23 (64) on anuria stage.
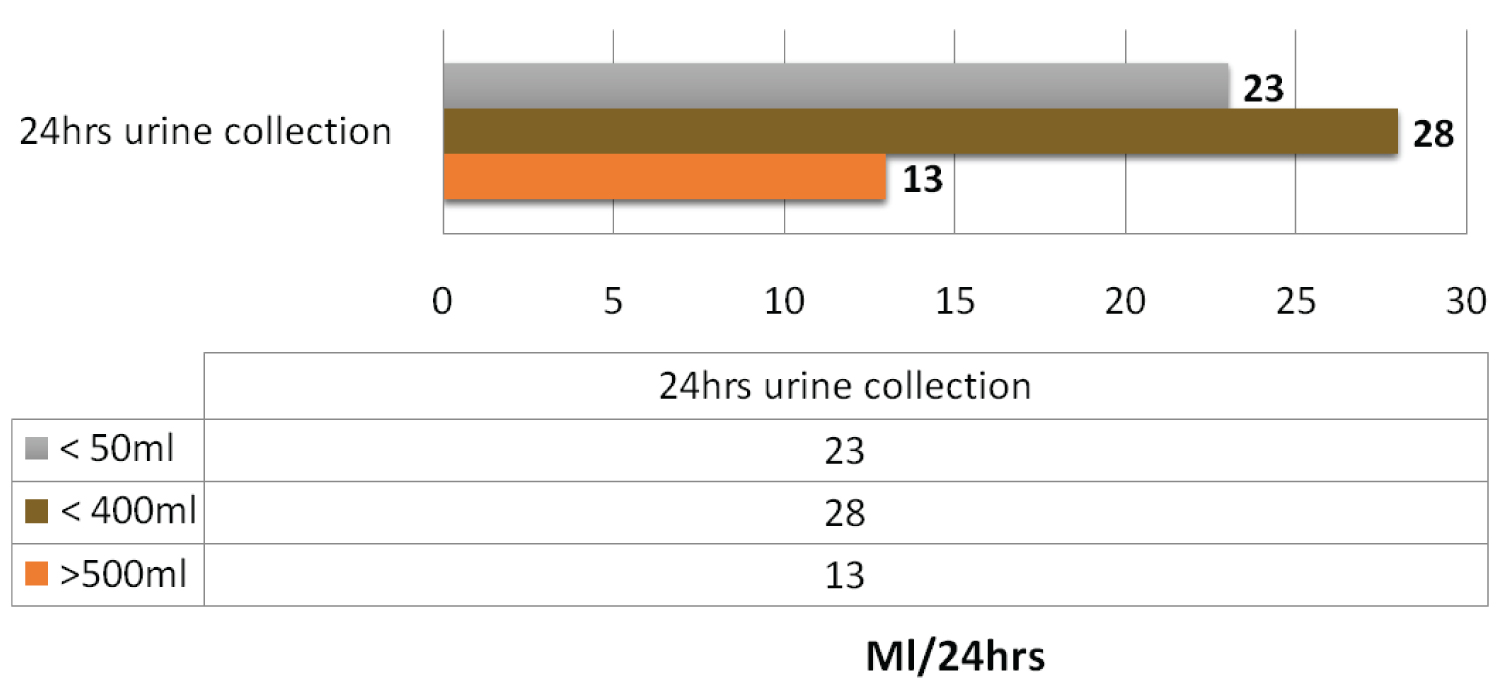 Figure 3: Shows the 24 hrs urine collection among the participants.
View Figure 3
Figure 3: Shows the 24 hrs urine collection among the participants.
View Figure 3
Our participants mostly depended on glucose (Dianeal) PD fluid to perform their dialysis because it is well accessible. They used different dianeal concentration depend on their fluid status and residual renal function. There were a total of 33 (49) patients on APD using two bags of 2.27% daily. 67.2% of total patients consumed about 4.5% of glucose PD fluid on daily basis. All anuric patients were given hypertonic solution (3.86%) for emergency use and they used an average of 3-4 bags per months. 55% of total patients were on Extraneal (Icodextrin) and 4.7% of them were on Nutraneal fluid (amino acid) beside glucose fluid.
The mean (SD) of systolic blood pressure was 145 (21.2) mmHg at pre-initiation on PD and improved to 134 (12.8) mmHg post PD. The mean (SD) of diastolic blood pressure was 82 (14.6) mmHg at pre-PD and improved to 77 (9.3) mmHg post PD, as shown in Table 2.
Table 2: Shows the mean (SD) and various stages of systolic and diastolic blood pressure readings of participants before and a year after starting peritoneal dialysis. View Table 2
There were significant improvements for most of tests' results after starting on PD, while some labs get worsen on PD, as shown in Table 3. Normal hemoglobin (Hb) (10-13 g/dl) was 46% of total patients then the percentage improved post PD to 78.1%. The mean (SD) of Hematocrit was 31.3 (6) before starting on PD, while it increased to 33.4 (5.5) post-PD. The percentage of patients having normal potassium level (3.5-6 mmol/l) post-PD increased to 85.9% compared to 58.7% pre-PD and the percentage of hyperkalemia Figure 4. The mean (SD) of serum sodium level was 135.8 (3.7), which improved to 137 (2.7) post PD. Acidosis improved post-PD by about 49%. Serum calcium and phosphate had positive effect post PD, there were 17.5% of patients had low calcium before starting on PD, then the percentage of them reduced to 1.6% only, and 85.2% had normal calcium value post PD compared with 58.7% pre-PD. The percentage of normal serum phosphate level reached to 54.7% compared with 36.5% before PD.
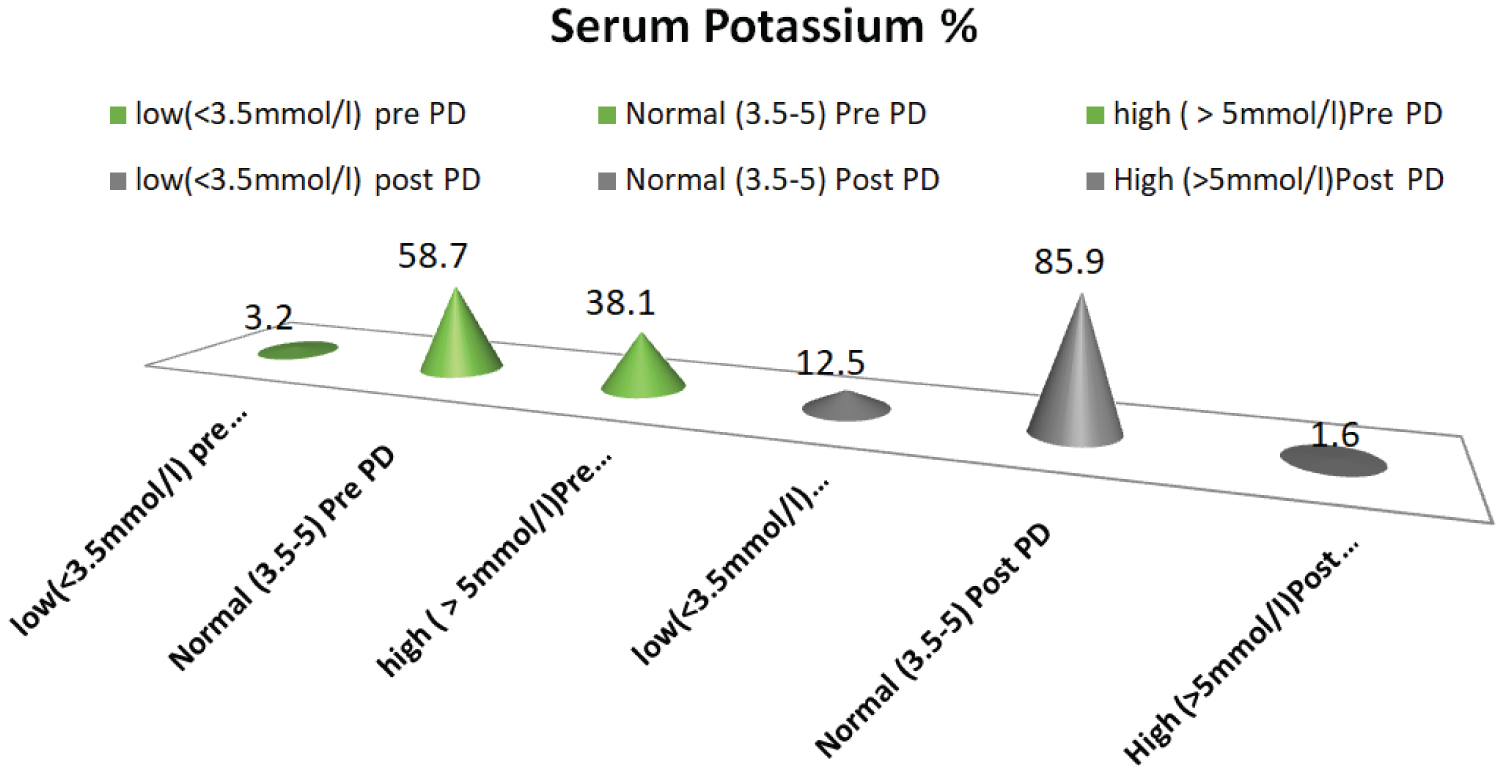 Figure 4: Shows the percentage of serum potassium levels before and post Peritoneal Dialysis (PD).
View Figure 4
Figure 4: Shows the percentage of serum potassium levels before and post Peritoneal Dialysis (PD).
View Figure 4
Table 3: Shows the mean (SD) and percentages of categorization of various Laboratory tests before and a year after starting peritoneal dialysis. View Table 3
On other hand, some variables been affected negatively by peritoneal dialysis initiation, as shown in graphs 5 and 6. Firstly, HBA1C has been classified as Normal, Pre-diabetes (42-47) and diabetic (≥ 48). Normal HBA1C level reduced to 43.5% from 54.1% of patients before starting on PD, and diabetic cases went up to 47.8% from 35.1% of patients, as shown in Figure 5.
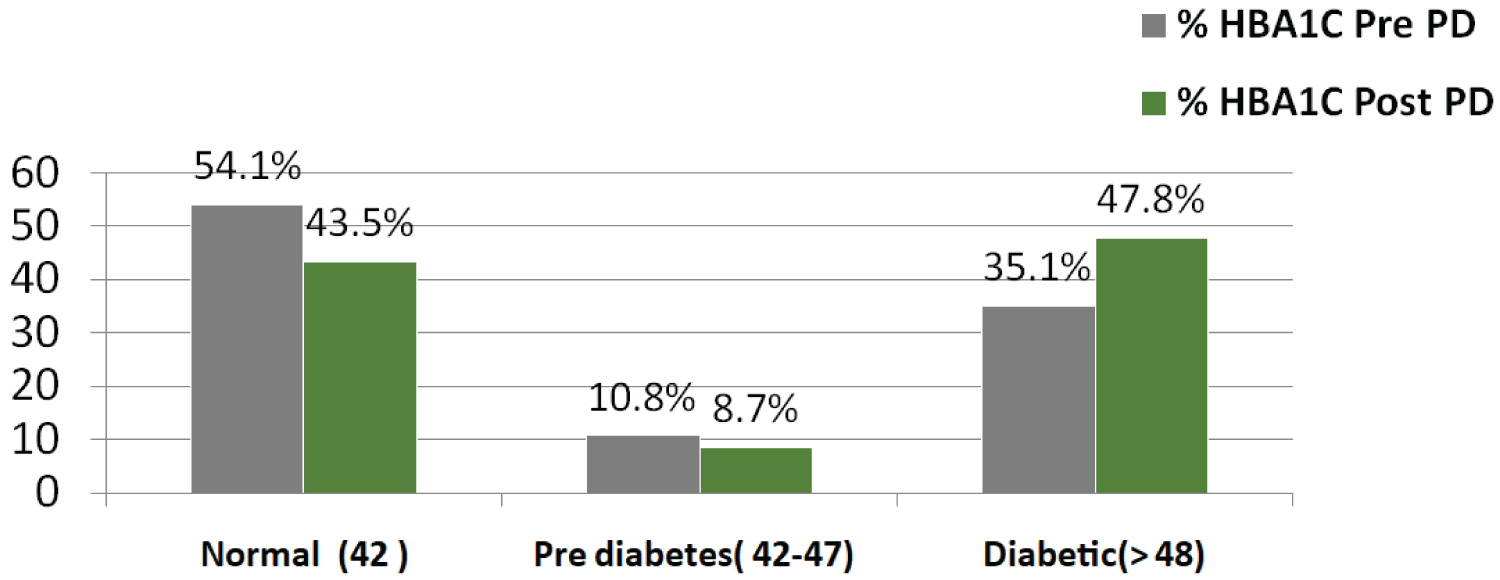 Figure 5: Shows the glycated hemoglobulin (HBA1C) levels before and after starting on Peritoneal Dialysis (PD).
View Figure 5
Figure 5: Shows the glycated hemoglobulin (HBA1C) levels before and after starting on Peritoneal Dialysis (PD).
View Figure 5
Another variable been disturbed post PD is serum albumin, our finding showed that, patients on peritoneal dialysis were losing albumin, about 87.5% of patients on PD had low serum albumin (< 35g) compared with 61.9% pre PD. Normal level of serum Albumin (35-40g) was 38.1% pre PD then it reduced to 12.5%, as shown in Figure 6.
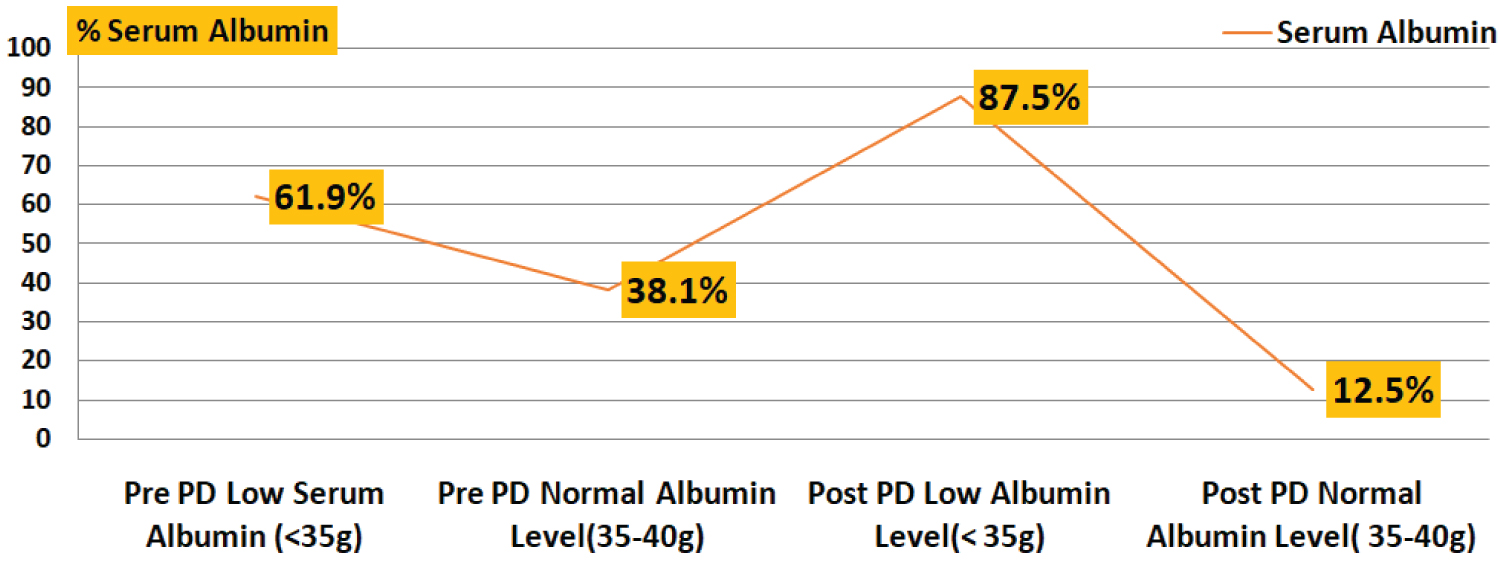 Figure 6: Shows the percentage of serum albumin levels of patients at pre and post Peritoneal Dialysis (PD).
View Figure 6
Figure 6: Shows the percentage of serum albumin levels of patients at pre and post Peritoneal Dialysis (PD).
View Figure 6
The percentage of patients with high serum triglyceride pre-initiation on PD was 15.4% then it increased to 19.4% on PD. Moreover, the percentage of patients having high serum glucose level increased by 1.4% and high serum cholesterol increased by 1.1% on PD, Table 3.
Regarding urine analysis, 40% and 37.5% of patients had positive leucocytes in their urine at pre-PD and post-PD, respectively. Only 4.9% of patients had nitrate pre-PD and 8.6% post-PD. 95.2% of patients had positive protein in urine pre-PD and remained high post-PD at 87.5%. The percentage of glucose in urine was 58.5% pre-PD and almost the same post-PD of 59.4%. Ketone in urine increased post-PD to 12.5% compared with 4.9% during pre-PD. Bilirubin in urine remained negative before and after starting on PD. Blood in Urine reduced by 19.5% post-PD, the percentage was 97.6 Pre PD and 78.1 post PD.
This study evaluated the clinical and laboratory data of patients on peritoneal dialysis following with the Renal Medicine department at Royal Hospital before and a year after peritoneal dialysis. It analyzed the patients' data including standard clinical examination and laboratory evaluation and the impact of glucose load and worse metabolic status before and after initiation of peritoneal dialysis. The population was composed of almost equal gender distribution with a mean age of 46.4 years. Of note, the total participants, 76.6% were on Automated Peritoneal Dialysis (APD) therapy. There were significant improvements for the first year period on PD for most patients and these improvements include laboratory parameters and blood pressure control. However, some parameters been affected with PD negatively such as serum albumin and HbA1C.
The participants mean age was 46.4 (1.1) years which is similar to Iranian PD patients' age, where their mean age was 46 years [14] and it is very close to Saudi PD patients in a study done at King Khalid University Hospital [15]. The number of female patients were slightly higher than male patients, females were 51.7% and males were 48.4%. Saudi male PD patients were 46% and Iranian male patients were 55%. The study of Al Rahbi N 2020 had close finding were the main age for PD patients was 41.7 ± 24.3 and the percentage of female were 60.4% [16].
Body Mass Index (BMI) was classified into three categories: underweight (< 18.5) kg/m2, normal weight (18.5-24.9 kg/m2) and overweight (˃ 25 kg/m2). The mean BMI was 25.4 (6.9), of which 45.3% of patients had normal weight, 15.6% of patients were under weight and 39% of them had overweight. The minimum BMI was 13 kg/m2 and the maximum BMI was 47.8 kg/m2. An Indian study [17] found that of the 328 PD patients, 47 (14.3%) were underweight, 171 (52.1%) were normal weight, 53 (16.2%) were overweight, and 57 (17.4%) were obese at commencement of PD therapy with mean BMI: 21.9 ± 3.8 kg/m2) for 20.0 ± 14.3 months. Another study done in Hong Kong for 274 PD patient, found that the mean BMI was 21.97 ± 3.23 kg/m2; 37 underweight (13.5%); 35 obese (12.8%) [18].
The present study found that 48.4% of patients were diabetics, 89% were hypertensive, and 46.9% had coronary artery disease. A 46.9% of total patients were having other disease beside the previous diseases. Researchers found that over 50 to 60% of hemodialysis patients and nearly 30% PD patients are hypertensive [14,19,20]. Blood pressure measurement classified to four categories: Systolic normal (< 120), pre-hypertension (120-139), stage 1 Hypertension and stage 2 Hypertension. The mean systolic blood pressure was 145 (21.2) at pre initiation on PD and improved to134 (12.8) post PD. Mean Diastolic BP at pre PD was 82 (14.6) and improved to 77 (9.3) post PD. Daily PD therapy along with residual renal function and salt diet restriction made PD effective treatment to control blood pressure, some of hypertensive patients on PD patients achieved reduced the dose of antihypertensive medication and some of them even able to hold their antihypertensive medication for the first period on PD. Peritoneal dialysis is a daily therapy, so it may not be surprising that only 30 percent of patients are estimated to require hypertension therapy. However, excess fluid in the body still plays a major role in causing the blood pressure to be high, and many peritoneal dialysis patients do not keep the fluid off as well as they should [19,20].
In the present study, about 41 (64%) of total patients were still having good Residual Renal Function (RRF). It is well known that the preservation of residual renal function makes a big difference in solute clearance and control fluid status and there are many studies support such a view including B Marro, et al. 2008 [21] and Roszkowska-Blaim, et al. 2013 [22]. Marro, et al. 2008 had mention that preservation of RRF is associated with better long-term survival (lower relative risk of death) in dialysis patients, 11-17 mmHg reduction in Blood Pressure (BP), 18 mm of left ventricular hypertrophy (LVH), 19-20 increased of sodium removal and 21-22 improved fluid status [21]. The study of Roszkowska-Blaim, et al. 2013, discussed the consequences of loss of residual renal function on patients health and they suggested that, RRF loss may result in suboptimal dialysis adequacy, necessitating changes in the PD protocol such as increasing the amount of dialysate fluid used, including high osmolarity fluids, and in some cases combining PD with hemodialysis or switching from PD to an alternative modality of renal replacement therapy [22].
Patients post initiation on PD experienced good wellbeing indicated by clinical and physical features during the first period on PD. Our study reported improvement of the following laboratory investigations improved post PD; Hb, RBC, WBC, Hematocrit, platelet, Urea, creatinine, GFR, Ca++, phosphate, PTH and Na+. The study of Jung, et al. 2019 [23] aimed to compare Health-Related Quality of Life (HRQOL) over time in patients initiating hemodialys is (HD) or Peritoneal Dialysis (PD), reported that PD shows better HRQOL during the initial period after dialysis even after adjusting for clinical and socioeconomic characteristics, and the effect lasts up to two years [23]. Another study done in Belgium in 1983 [24], investigated the anemia on CAPD, the study distributed the participants to three groups depends on their periods on PD, from 1 to 6 months, from 6 to 12 months and third group from 12 to 24 months, concluded that CAPD results in an early improvement of the uremic anemia, as demonstrated by a significant increase in red cell mass. However, the changes in routine hematological parameters are also profoundly influenced by an important decrease in circulating plasma volume occurring with this form of therapy.
Serum potassium was reduced by 12.5% post PD in our patients, which possibly was possibly achieved by both daily PD therapy and dietary restriction. In a study done by Xu, et al. 2014 [25], a total of 886 incident PD patients were enrolled, with 248 patients (27.9%) presented with hypokalemia (serum potassium < 3.5 mEq/L). During a median follow-up of 31 months (range: 0.5-81.0 months), adjusted all-cause mortality Hazard Ratio (HR) and 95% Confidence Interval (CI) for baseline serum potassium of < 3.0, 3.0 to < 3.5, 3.5 to < 4.0, 4.5 to < 5.0, and ≥ 5.0 mEq/L, compared with 4.0 to < 4.5, were 1.79 (1.02-3.14), 1.15 (0.72-1.86), 1.31 (0.82-2.08), 1.33 (0.71-2.48), 1.28 (0.53-3.10), respectively [25].
HBA1C and serum Albumin been affected negatively by peritoneal dialysis as approved by our study. Participants having normal serum HBA1C level been reduced from 54.1% before PD to 43.5% post initiation on PD. This can be explained by dietary intake or glucose reabsorption from PD fluid. The study of Coelho, et al. 2014 reviewed HBA1C with peritoneal dialysis and reported that in the PD population, there was a positive correlation between blood glucose level and peritoneal dialysis that contribute to changes in HbA1c, although weaker due to the influence of other factors [26]. Furthermore, the daily glucose load of PD patients was conditioned not only by the diet but also by the potential reabsorption of glucose peritoneal fluids used as dialysate [20,26]. In PD, continuous glucose loading from the conventional dialysis solution may contribute to the increased cardiovascular risk that is a major cause of death in ESRD patients [27].
Peritoneal membrane prognosis is independent of baseline transport characteristics. Intrinsic fast transport and low UF are reversible conditions when peritonitis and high glucose exposure are avoided during the early dialysis period. Icodextrin helps in glucose avoidance and is associated with peritoneal protection [28]. The type of peritoneal membrane has a role on glucose absorption and fluid retention. Fast transporter membrane has the character of the fast dissipation of glucose from the peritoneal cavity, with negative ultrafiltration in dwells with 1.36% glucose longer than 180 min. In this study the majority (40.4%) of patients were having high average membrane and 9.6% had high transport membrane [28].
Hypoalbuminemia among our PD patients increased to 25.6% after starting on the peritoneal dialysis therapy. There are some factors contributed to the loss of albumin such as solute transport through diffusion process during peritoneal dialysis therapy or it could be the less consumption of proteins by the patients and/or the fluid overload status of the patients. A study done by Margetts, et al. suggested that low albumin is associated with high transport membrane and poor outcomes associated with low serum albumin and higher peritoneal membrane transport might be explained by other underlying factors. The contribution of inflammation, malnutrition, and fluid overload requires further study [29].
In this study, high triglyceride level increased among patients on PD by 4%. The study by Natalia Stepanova 2019 found a strong association between lipid profile and PD adequacy parameters and it also found a significantly higher all-cause PD technique failure rate in patients with atherogenic dyslipidemia at baseline [30]. Moreover, the higher cause of this failure is explained by present of other factors such as longer PD duration, a decrease in RRF, and glucose absorption from the dialysis fluid.
World-wide, each country must have a specialized peritoneal dialysis nurse coordinator at each hospital and at regional areas of the country [31,32]. Having a nurse led program, utilizing a clinical pathway that runs in all clinics throughout the country is of utmost importance to improve the health related quality of life [33,34]. The program should involve a routine surveillance of all ESKD patients and a direct referral of cases to the nurse PD coordinator clinics [32,35]. This would lead to the development of many actions planned in relation to permanent PD dialysis-catheter care improvement.
There is an excellent health system in Oman, and it has been appraised highly by the World Health Organization [4,5]. Oman and its region at large have major issues with PD accessibility and management. There is a very urgent need to study the currently existing disparities for dialysis access. Initially, the survey should just focus to assess the current infrastructure that exist throughout the country including coordinators, dedicated access surgeons or interventionists. There is possibly a need for a wide-spread survey of PD services among all units with their responses being completely anonymized, to encourage everyone to participate and to therefore help us to be at a better position to understand the current existing gaps.
There is a need to collect PD access data from each individual Renal center throughout the country. This will enable us to understand the reasons behind the high failure for PD enrollment. There are many reasons, to mention a few such as patient refusal, late patient referral, poor patient selection, inadequate surgery service, lack of monitoring, poor surveillance, poor interventional services and insufficient education of both patients and clinicians. Building a multidisciplinary PD access team in each region, country or city is an essential starting step. This team requires a PD coordinator and an interventionist. The interventionist does not have to be an interventional nephrologist but can be a surgeon or an interventional radiologist. This should be supported with a surveillance and quality assurance program.
There is a need to provide a curriculum for the PD therapy coordinator that meticulously explains the PD program aims, methods, endpoints, surveillance, quality assurance and so on. There is also a need to have regular training courses for the coordinators, as well as various members of the PD therapy team. Collaboration with the International Societies of Nephrology and Peritoneal Dialysis is an important corner of the PD therapy/access team for updates, follow ups of successes, challenges and to help with training and guidance.
The outcome of a PD therapy is reasonably very successful, both clinical and laboratory outcomes in ESKD. It is of great importance to have a multi-disciplinary approach including nurses, nephrologists, surgeons and intervention radiologists in ensuring an optimal PD therapy. A specialized-PD nurse coordinator is a significant contribution to any department to improve the success rates of PD among our population, to improve first long-term PD strategy and to improve the nurse led PD therapy surveillance program.
PD therapy coordinators should have regular meetings to discuss PD therapy issues and to regularly collect data for dialysis events including catheter related infections, dedicated and or access intervention time and the prevalence of cases in the hospital units. There is a regional need to cooperate, discuss, share data and experiences to promote better PD therapy care in our region. This will create a platform where professionals from all related PD-disciplines in the region could come together and share ideas and expertise on how to improve this aspect of PD-dialysis care with solutions which are more relevant to the region that share similar demography and patient characteristics.
PD service utilization is increasing as time pass on in Oman because of its advantages and restrains with hemodialysis. It gives higher chance for freedom, dependency and share responsibilities compared with hemodialysis. Moreover, it releases overwhelmed on hemodialysis centers. There was an almost equal gender distribution with young age and almost half have diabetes and 90% with high blood pressure. Most people utilized APD as a modality choice compared to CAPD. PD data showed improved on patients' wellbeing and quality of life over a year period of PD therapy. Most laboratory data and blood pressure reading improved, but there was a raised in some of blood investigation, such as, glycated hemoglobin and drop in serum albumin level.
It is recommended to work hardly on PD Continuous Quality Improvement (CQI) by identifying problems, develops solutions, monitor clinical outcomes and evaluates results in a clear manner in order to improve patients care in order to develop PD program in Oman.
None.
Authors declare no conflict of interest.