Aims: As continuous glucose monitoring (CGM) becomes increasingly utilized, it is relevant to better understand the relationship between CGM metrics and HbA1c. We aimed to assess the concordance between HbA1c and both glucose management indicator (GMI) and time in range (TIR) in youth with type 1 diabetes (T1D).
Methods: CGM data up to 3 months before a clinic HbA1c measurement were retrospectively collected from 133 T1D youth. GMI and HbA1c agreement was explored with Bland-Altman plots and associations between variables by linear regression.
Results: Only data from 117 youth (48.7% male) with CGM use ≥ 70% were included in analysis: Mean age was 11.9 ± 3.4 years, T1D duration 5.1 ± 3.7 years, HbA1c 57.2 ± 11.7 mmol/mol, and GMI 59.0 ± 9.3 mmol/mol. 39 youth used intermittently scanned (isCGM) and 78 real-time (rtCGM) CGM.
HbA1c was significantly associated to TIR (r = -0.86, p < 0.001) and GMI (r = 0.91, p < 0.001). There was a difference of 1.8 ± 5.1 mmol/mol between GMI and HbA1c. Factors affecting this difference were CGM type (rtCGM vs. isCGM) [B coefficient (SE): -2.6(1.06), p = 0.015], BMI SDS [-1.15(0.46), p = 0.015], and age [0.39 (0.18), p = 0.028].
Conclusions: GMI and TIR were strongly associated to HbA1c. However, there was a significant difference between GMI and HbA1c, affected by age, body mass index SDS, and the type of CGM, which should be considered in clinical practice.
Continuous glucose monitoring, Children and adolescents, Bland-Altman plots
Hemoglobin A1c (HbA1c) is the gold standard parameter to assess glycemic control and its association with long-term diabetes outcomes [1]. However, it does not provide any information on short-term glycemic variations including exposure to hypoglycemia and hyperglycemia [2]. In addition, HbA1c can be inaccurate in conditions like hemoglobinopathies and anemia.
Recent advances in diabetes technology like continuous glucose monitoring (CGM) made it possible to measure outcomes beyond HbA1c [3]. In 2017, the ‘Beyond A1c Working Group’ recommended that HbA1c should be used in association with glycemic metrics from CGM like average blood glucose, glycemic variability, and incidence of nocturnal hypoglycemia, and proposed using 2-week Ambulatory Glucose Profile (AGP) data in research and clinical settings [4]. The widely endorsed international consensus on Time-in-range (TIR) also recommends day-to-day clinical decision-making based on CGM metrics [5].
Factors like improved affordability and accuracy, factory calibration (no fingerstick), and longer-lasting sensors requiring less frequent sensor changes contributed to the remarkably increased the uptake of CGM devices. By providing detailed data on glucose patterns and their variations caused by diet, physical activity, and health status, CGM helps in optimizing clinical care daily.
In 2008, the ADAG (A1c-derived average glucose) study group introduced the concept of estimated A1c (eA1c) derived from mean blood glucose (MBG) and this was validated later [6-11]. As eA1c could be misinterpreted to be in close and direct relation with lab-HbA1c, the term Glucose Management Indicator (GMI) was coined, and a more precise formula was derived to calculate it [12,13].
HbA1c can be higher or lower than GMI due to variations in hemoglobin glycation rates. Many adult studies reported HbA1c-GMI discordance that was higher than in initial reports [14-16]. Data from youth with T1D is limited. In a recent study in children and adolescents by Piona, et al., GMI was shown to be significantly discordant from HbA1c in almost a third of the study participants, and that could not be explained by age, sex, puberty, or type of CGM [17]. In studies performed in mixed populations of children and adults with T1D, a similar GMI-HbA1C discordance was seen in up to one-third to half of participants [14,18].
TIR is another CGM metric that has drawn considerable interest as a potential tool to predict long-term diabetes outcomes after a retrospective analysis of the Diabetes Control and Complications Trial (DCCT) dataset showed that the TIR computed from a 7-point/day fingerstick glucose testing for 3 months was strongly associated with the risk of retinopathy and microalbuminuria [19]. The correlation between HbA1C and TIR has been reported to be moderate to strong [20,21].
The present study aimed to assess the concordance between HbA1C and both GMI and TIR at various durations of CGM use in a clinical population of children and adolescents with T1D.
Following institutional approval, data on 133 children and young people (age 2-18 years) from a single tertiary centre (paediatric diabetes department at Addenbrooke's Hospital, Cambridge), were retrieved from the hospital's electronic patient database and anonymized at collection.
Data collected from electronic medical notes included age at last visit, duration of T1D, age at diagnosis, sex, and anthropometric parameters (height, weight, BMI), which were converted into Standard Deviation Scores (SDS) for the UK population using the LMS method [22] and the latest HbA1c.
Real-life CGM data over the 2 weeks, 1 month, 2 months, and 3 months preceding the laboratory HbA1c measurement were collected retrospectively from the Clarity (for Dexcom) and Libreview (for Libre) platforms. CGM metrics collected were % CGM use, TIR, Coefficient of Variance (CoV), and average BG.
Glucose management indicator was calculated using the formula derived from adult T1D data: GMI (mmol/mol) = 12.71 + 4.70587 × [mean glucose in mmol/L] [12].
Data are expressed as mean (SD) unless otherwise specified. Differences between the rtCGM and isCGM groups were assessed with a Chi-square test for categorical variables and an independent t-test for continuous variables. P value < 0.05 was considered statistically significant.
To analyze the agreement between GMI and HbA1c, Bland-Altman plots were constructed. The absolute difference between GMI and HbA1C was calculated for each participant after converting them into percentage units and is reported as GMI-HbA1C difference. Regression analyses were performed to assess the association between HbA1c and CGM metrics and assess factors associated to the GMI-HbA1c difference.
MedCalc Statistical Software version 20-218 (MedCalc Software, Ostend, Belgium; https://www.medcalc.org; 2023) was used for statistical analysis and constructing Bland-Altman plots.
Data from 117 participants with CGM use ≥ 70% were analyzed, whereas those from 16 participants with < 70% CGM use were excluded. The mean (SD) age of participants was 11.9 ± 3.4 years, 48.7% were male, T1D duration was 5.1 ± 3.7 years, HbA1c was 57.2 ± 11.7 mmol/mol (7.4 ± 1.1%), and 3-month GMI was 59.0 ± 9.3 mmol/mol (7.5 ± 0.8%) (Table 1).
Table 1: General characteristics of the study population. View Table 1
39 participants used intermittently scanned (isCGM Abbott FreeStyle Libre ® Glucose Monitoring System) and 78 used real-time (rtCGM, Dexcom G5 ® CGM System or Dexcom G6 ® CGM System) CGM systems. No significant differences in sex distribution (male 53% vs. female 41%), weight, height, and BMI SDS were found between participants using isCGM vs. rtCGM. However, those using rtCGM were significantly younger (11.0 ± 3.6 vs. 13.7 ± 1.9 years, p < 0.001), had higher CGM use (94.5 ± 6.3% vs. 88.3 ± 9.0%, p < 0.001), and a lower HbA1c (54.7 ± 10.8 vs. 62.1 ± 12.1 mmol/mol, p = 0.002). Mean GMI was significantly higher than HbA1c (57.2 ± 8.5 vs. 54.7 ± 10.8 mmol/mol, p < 0.001) in the rtCGM group while it was similar (62.7 ± 9.9 vs. 62.1 ± 12.1 mmol/mol) in the isCGM group. No significant differences in CGM metrics collected during the 4 different time blocks (2 weeks, 1, 2, 3 months) were found (Supplementary Table S1). Thus, for subsequent analyses, 3 months CGM metrics were used.
Linear regression showed a significant and strong inverse association between TIR and HbA1c (r ALL = -0.86, p < 0.001) (Figure 1). A strong correlation was also found between GMI and HbA1c (r ALL : 0.91, p < 0.001). Bland-Altman Plots showed an overall bias between HbA1c and GMI of 1.8 mmol/mol. This bias was higher for rtCGM than isCGM (2.53 mmol/mol vs. 0.68 mmol/mol) (Figure 2).
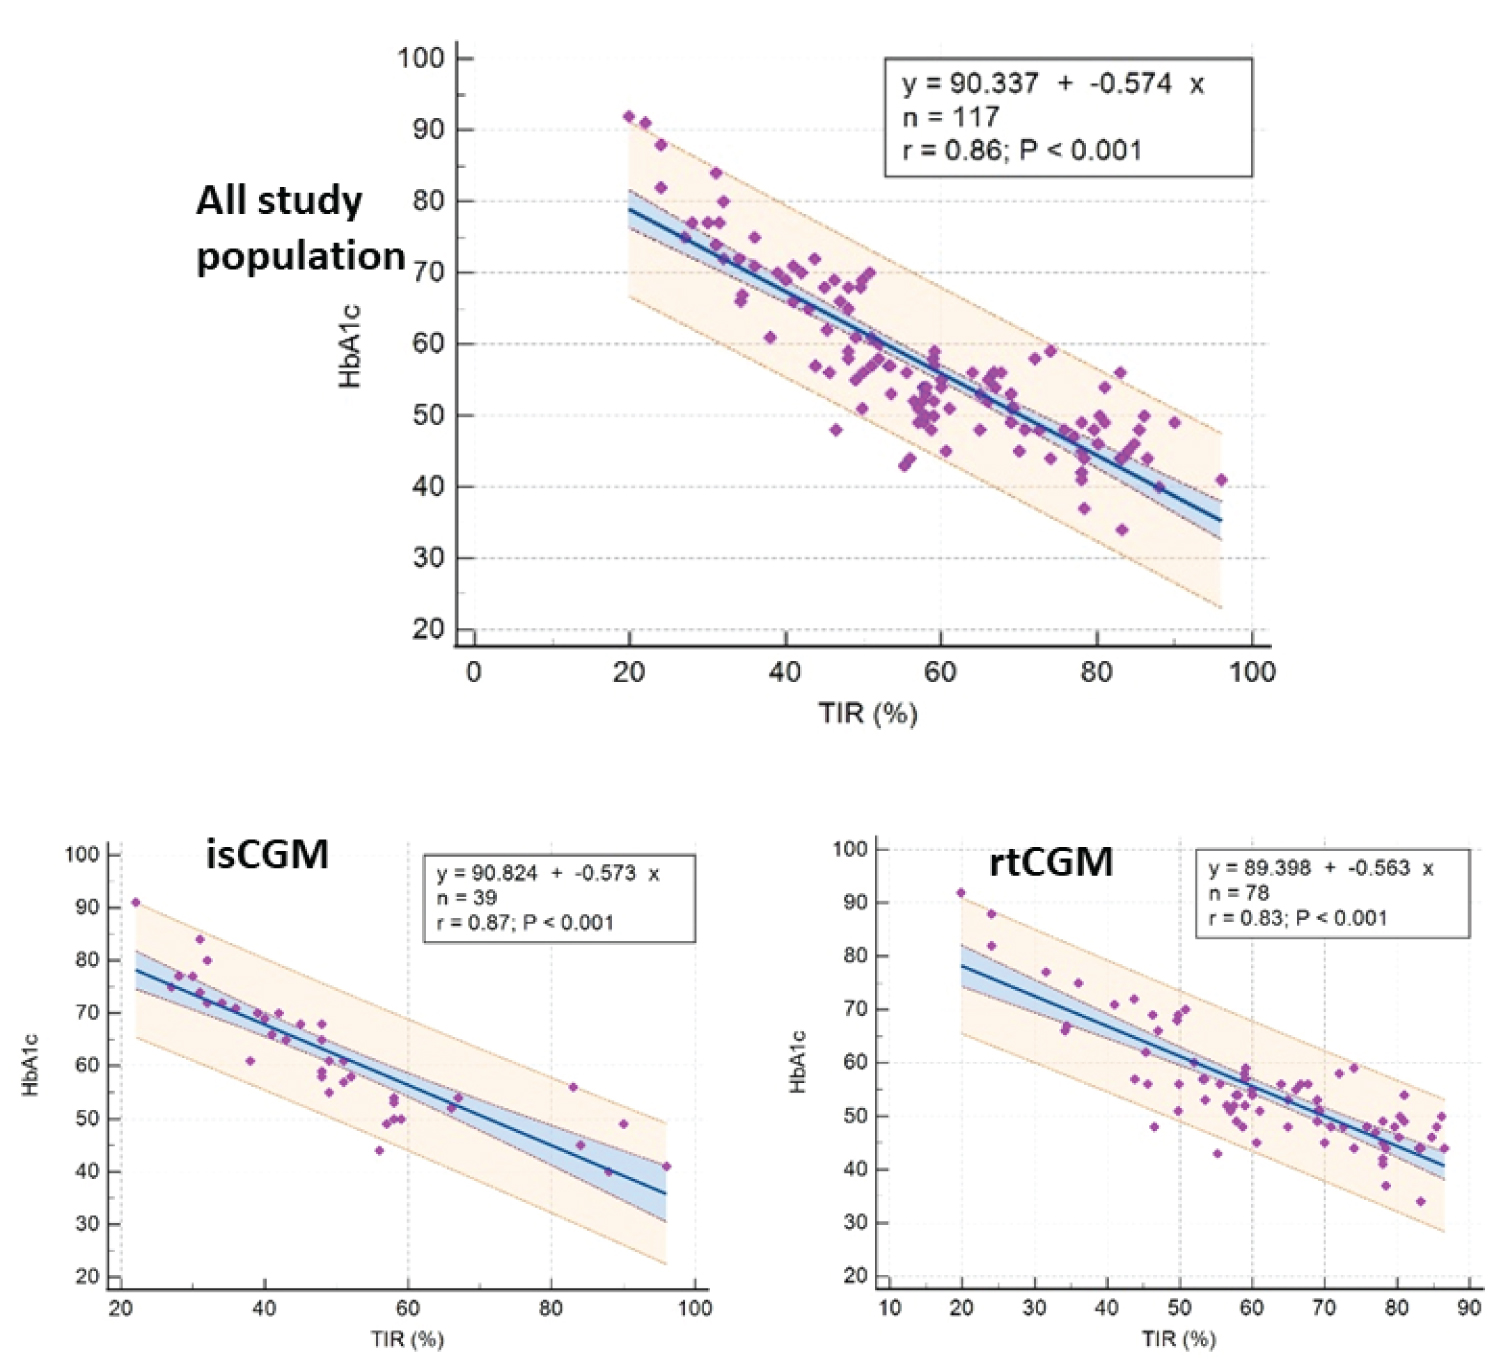 Figure 1: Relationship between Time in range (TIR) and HbA1c at 3 months.
View Figure 1
Figure 1: Relationship between Time in range (TIR) and HbA1c at 3 months.
View Figure 1
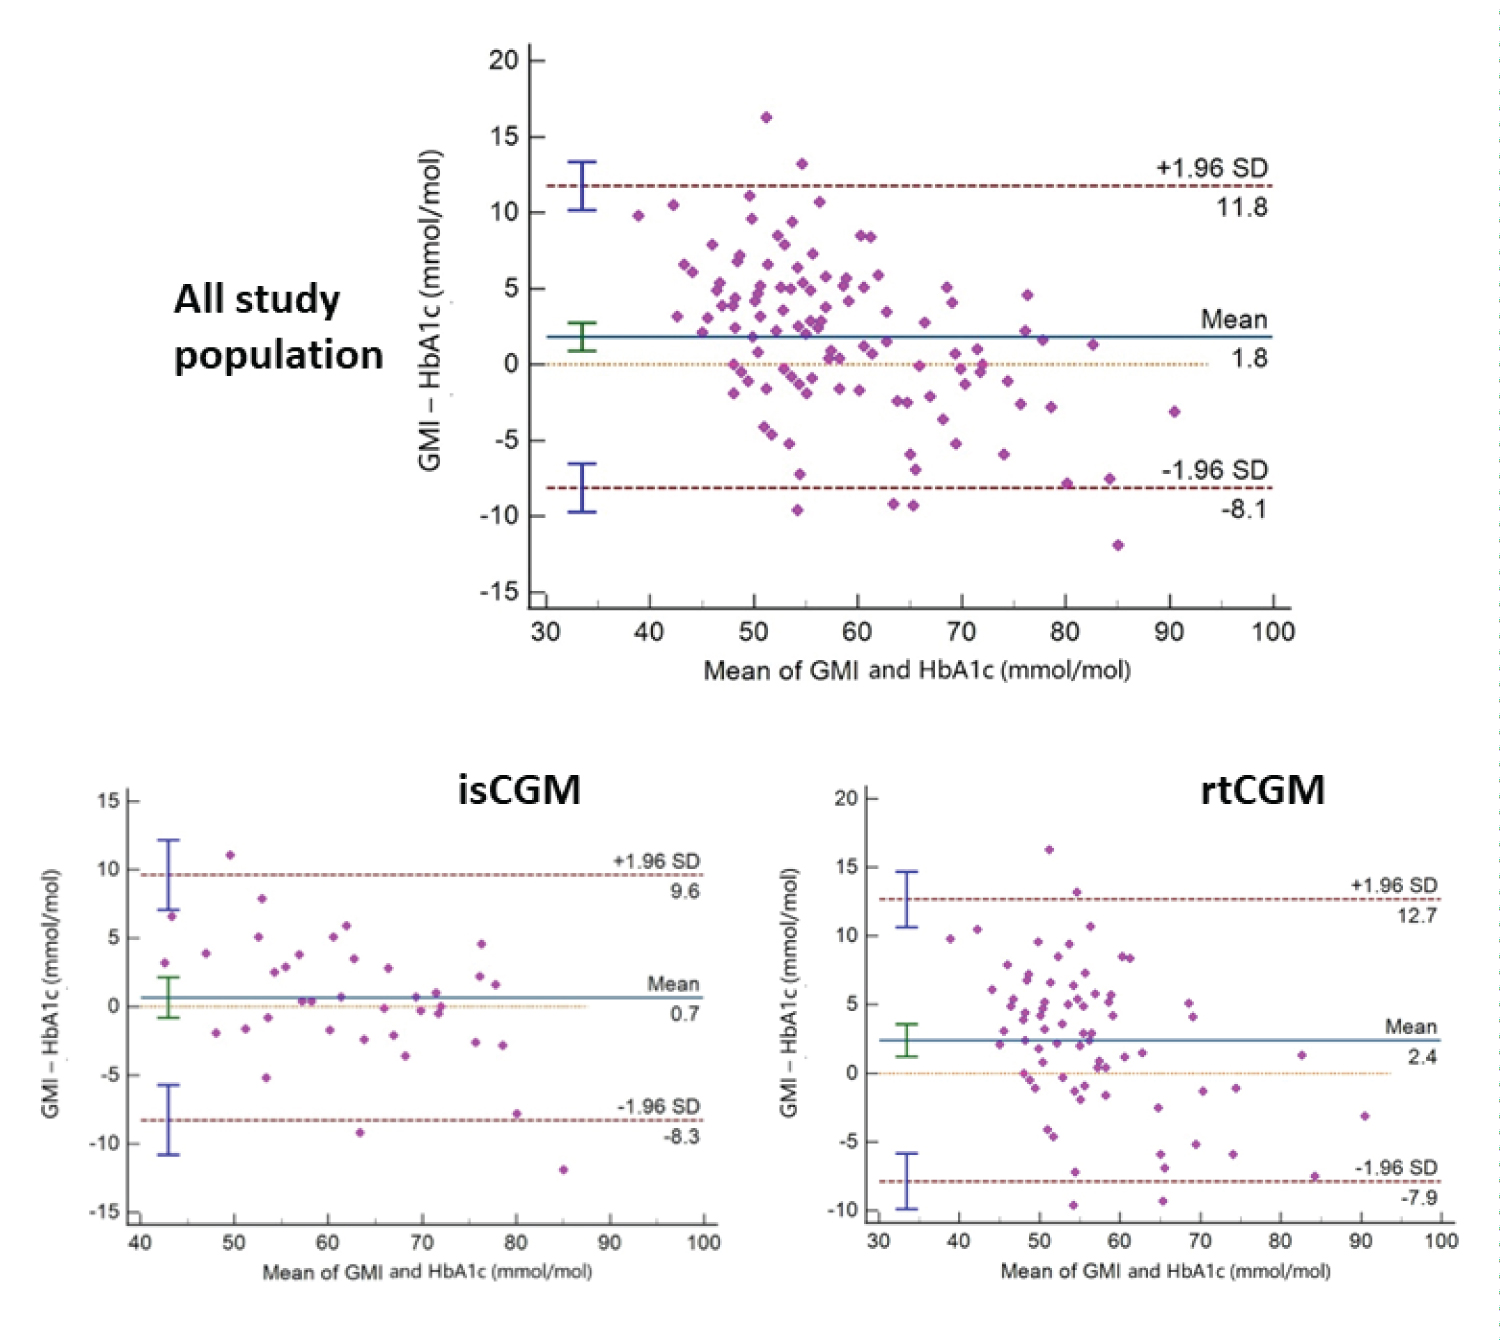 Figure 2: Bland- Altman Plots (Difference between Glucose Management Index and Hemoglobin A1c vs. the average of the two measurements).
View Figure 2
Figure 2: Bland- Altman Plots (Difference between Glucose Management Index and Hemoglobin A1c vs. the average of the two measurements).
View Figure 2
In a multiple regression analysis, variables independently associated with the GMI-HbA1C difference were the type of CGM in use (rtCGM vs. isCGM) (Coefficient (SE): -2.6 ± 1.06, p = 0.015), BMI SDS [-1.19 ± 0.44, p = 0.008] and age (0.39 ± 0.18, p = 0.028). Sex and duration of T1D did not influence it (Table 2).
Table 2: Multiple regression analysis: factors associated with the GMI-HbA1C difference. View Table 2
When expressed in percentage units, the overall GMI-HbA1C difference was < 0.1% only in 10.2% of participants, and lower in rtCGM than isCGM group (7.7% vs. 15.4%). The difference was ≥ 0.5% in 41% (47.4% in rtCGM vs. 28% in isCGM, p = 0.04), and in 4.3% it was ≥ 1% (Figure 3).
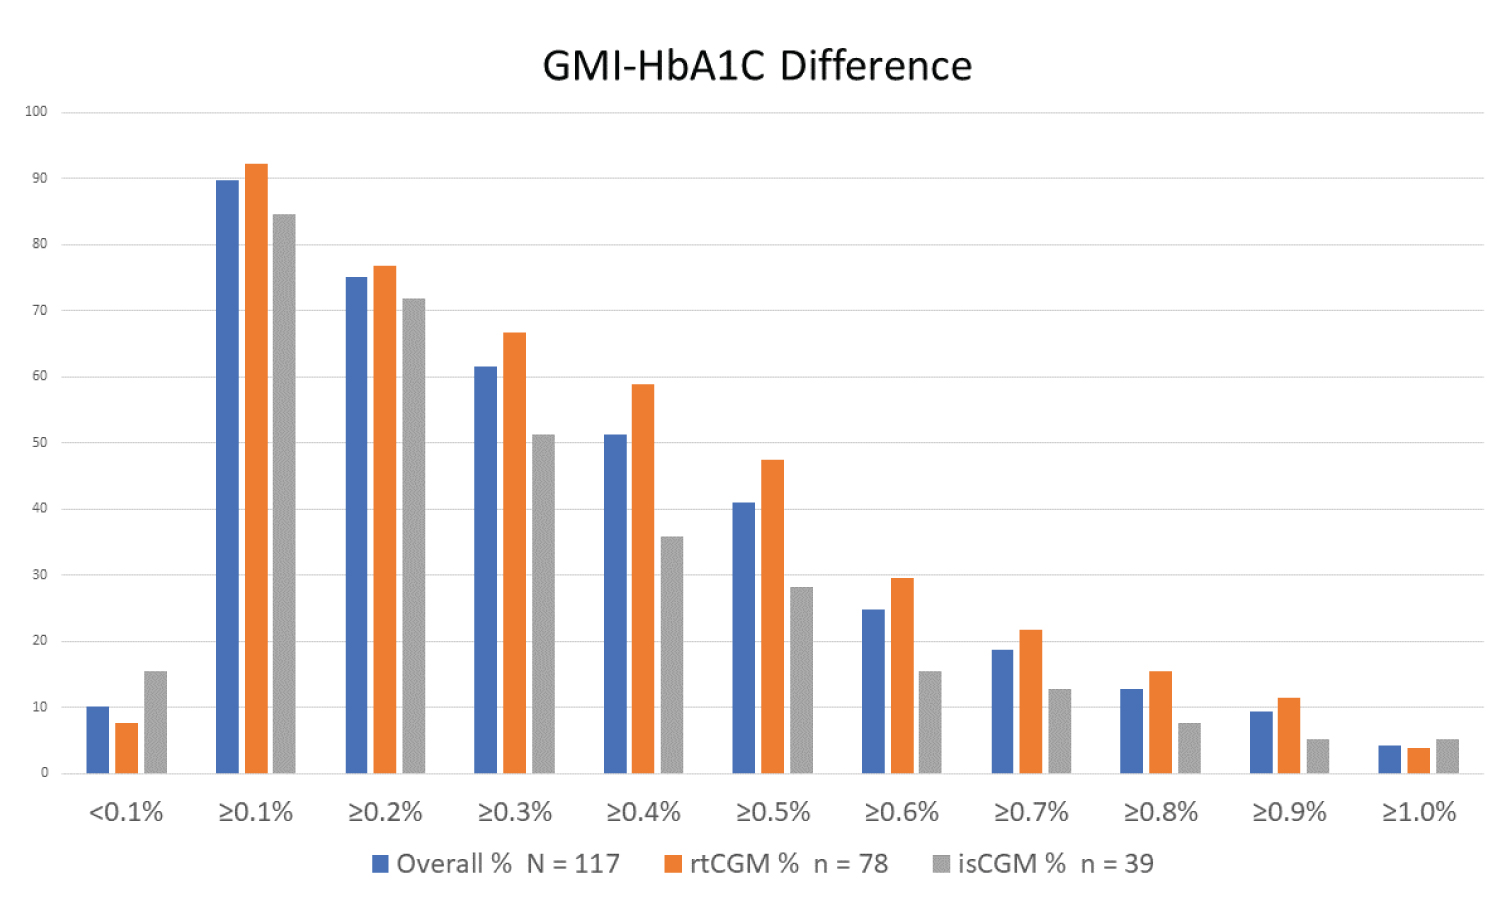 Figure 3: GMI-HbA1c difference (GMI and HbA1c in % units).
View Figure 3
Figure 3: GMI-HbA1c difference (GMI and HbA1c in % units).
View Figure 3
In a single-centre clinical cohort of children and adolescents with T1D, there was no difference in CGM metrics collected over different durations (1, 2, 3 months, and 2 weeks), which is in agreement with previous studies [23,24]. As reported earlier, we observed a strong correlation between HbA1c and TIR, and HbA1c and GMI, although GMI was significantly higher than HbA1c.
The difference between GMI and HbA1c (expressed in % units) was significant and only 10.2% of youth showed a difference of less than 0.1%, while 41% had a difference ≥ 0.5% (Figure 3). This difference is significantly higher than the discordance initially reported by Bergenstal, et al., [12]. In a recent study involving mostly adults with T1D, only 11% had an HbA1c-GMI discordance of ≤ 0.1%, almost 50% had a discordance of ≥ 0.5% and 22% had a discordance of ≥ 1%, with chronic kidney disease being the only statistically significant variable affecting this difference [15]. In a mixed population of older adults with T1D and T2D, the average absolute difference between HbA1c and GMI was similar across all four observed time spans within the HbA1c coverage period, and T2D and higher BMI were associated with increased discordance [16]. In a recent study in T1D adults using Freestyle Libre2, 61.3% had a discordance of ≥ 0.3%; older adults, those with lower mean corpuscular volume (MCV), and higher red cell distribution width (RDW) had higher HbA1C than GMI [25].
When evaluating factors influencing the GMI-HbA1c difference, we found that the difference was higher in older children and those with lower BMI. When we analyzed our data by sensor type, GMI and HbA1C difference was higher in the rtCGM group. This was in contrast to the previously published data from a group of children and adults with T1D where the mean GMI and HbA1C were similar in the rtCGM group but the mean GMI was significantly higher in the isCGM group [18]. However, in other studies of children and adults with T1D, the type of CGM did not affect this discrepancy, neither did other factors like age, gender, or puberty [15,17] (Supplementary Table S2).
Individual variations in hemoglobin glycation are determined by many factors including variations in red blood cell (RBC) life span, RBC glucose transport, iron homeostasis, and underlying genetic and probably hereditary influences [26,27]. In a given individual, these differences in glycation rates tend to persist over time [28]. Given how some of these factors significantly distort the HbA1c and widen the GMI-HbA1C discordance, measures like RBC life span-adjusted A1C and personalized A1C were proposed by some groups [29,30].
Understanding the relationship between mean glucose, GMI, and HbA1c is important to optimize glycemic control and individualize diabetes care plan. If an individual’s HbA1c is higher than GMI, setting a lower HbA1c goal would substantially increase their risk of hypoglycemia. On the contrary, if the HbA1c is always lower than GMI, keeping a tighter HbA1c target would help to control excessive hyperglycemia [12,31,32].
Our cohort had an excellent correlation between GMI and TIR which was slightly higher in the isCGM group. A previous analysis of four RCTs in T1D adults showed only a moderate correlation between TIR and HbA1c and for a given TIR, there was a wide range of possible HbA1c levels [20]. Our findings were similar to a later study that combined data from 18 published studies, all but one in adults and found an excellent correlation between the two [21].
One of the limitations of our study is that we did not collect data on variables that can impact the GMI-HbA1C difference by influencing the hemoglobin glycation like hemoglobin status, and RBC parameters. Data were collected during a limited period in a single UK tertiary diabetes center before CGM became widely available for all children and young people with T1D. Larger, multi-center studies looking at the factors affecting the GMI-HbA1C discordance in children and adolescents are needed to make practical recommendations for clinicians to use in their daily practice.
Sirisha Kusuma Boddu received a clinical fellowship grant fund from the International Society for Pediatric and Adolescent Diabetes (ISPAD). The other authors have nothing to disclose.