Introduction: Globally 144 million children under the age of five were stunted, 47 million were wasted, and 38 million were overweight and 1.9 billion adults are overweight or obese, while 462 million are underweight. People living in humanitarian crisis areas such as refugee and IDP camps are particularly vulnerable groups accounting the highest portion of this numbers. However, there is limited information on the nutritional status and determinants factors of malnutrition among refugee and IDP camps in developing countries like Ethiopia, particularly in Debark refugee camp.
Method and materials: Cross-sectional study was conducted with a systematic random sampling technique from March 09 to May 13, 2022. Sociodemographic and other variables were collected by trained data collectors using structured questionnaires in face-to-face interviews. Anthropometric measures (such as mid-upper arm circumference), height, and weight were measured. Five ml of venous blood was collected for biochemical parameter assessment from children and adults while three ml was taken from infants. Both bi-variable and multivariable logistic regression analysis were performed to measure the association between malnutrition and associated factors. A P value of < 0.05 was considered statistically significant.
Results: The overall prevalence of malnutrition in Debark refugee camp was 44% (n = 135) (95% CI: 38.7, 49.8). Vitamin B12 and folic acid deficiency among the IDPs were 44% and 21.8% respectively. Low dietary diversity (AOR = 3.7, 95% CI: 1.4, 9.9), low literacy (AOR = 3.1, 95% CI: 1.1, 8.2), and high perceived stress (AOR = 3.5, 1.04, 11.6) diarrheal disease (AOR = 3.7, 95% CI; 1.4, 9.8), and low concentrations of albumin (AOR = 3.1, 95% CI: 1.1, 8.5), folic acid (AOR = 3.1, 95% CI: 1.07, 9.0), and total protein (AOR = 7.25, 95% 2.7, 19.3) were determinant factor of malnutrition among IDPs in Debark refugee camp.
Conclusion and recommendation: The prevalence of malnutrition among IDPs in Debark refugee camp was high public health problem. In addition, the prevalence of micronutrients deficiency was also high. Therefore, periodic nutritional assessment, education with regard to effective personal & environmental sanitary practice, provision of diversified food supplementation and focused policies and strategies towards IDPs particularly in conflict areas should be planned to alleviate problems associated with malnutrition.
Anthropometric measurement, Biochemical parameters, Internally displeased person, Malnutrition
Nutritional status is defined as the state of health resulting from usual food intake, digestive processes, absorption, and the influence of pathological factors. Nutritional assessment is a systematic approach that includes anthropometric measurements, collection of information on the patient's medical history, biochemical characteristics, dietary habits, current treatment, and food security situation [1]. The World Health Organization (WHO) defines malnutrition as "the cellular imbalance between the intake of nutrients and energy and the body's need for these substances to ensure growth, maintenance and specific functions" [2]. Conflicts and disasters often result in massive displacement of people due to destruction of home and environment, religious or political persecution, or economic hardship [3].
Internally displaced persons are individuals or groups of individuals who have been forced to leave their place of habitual residence, in particular as a result of armed conflict, situations of generalized violence, human rights violations, natural or man-made disasters, or to escape their effects, and who have not crossed an internationally recognized State border [4]. More than 20 million people are displaced worldwide, with more than half of them living in sub-Saharan Africa [5]{Amare, 2019 #102}. Insurgencies and political instability have displaced an average of 5.2 million people over the past 13 years, mostly in the Middle East and sub-Saharan Africa, including Ethiopia [6].
The major problems facing humanitarian crisis areas, malnutrition accounts for the majority of social problems. The most prevalent form of malnutrition is undernutrition which includes underweight, emaciation (wasting), stunting, and micronutrient deficiencies. The second most common form of malnutrition is over nutrition, which includes overweight and obesity [3].
Wasting is low weight in relation to body size. It indicates a current weight loss because a child is not eating enough food or is exposed to infectious diseases such as diarrhea, malaria, tuberculosis, chronic liver and kidney diseases leading to lose of weight. Stunting is low height in relation to age. Stunting refers to children who are too short in relation to their age. Stunting is the result of poor nutrition in early childhood that can last a lifetime, whereas underweight means low weight in relation to age and includes stunting, wasting, or both [1,7,8].
Primary acute malnutrition is the result of inadequate food supply caused by socioeconomic, political, and environmental factors and is most common in low- and middle-income countries [9]. This is one of the most common problems faced by IDPs and factors responsible for it include household food insecurity, poverty, poor nutrition of pregnant women, low birth weight, poor breastfeeding and inadequate complementary feeding, frequent infectious diseases, poor water quality, hygiene, etc [10].
The foundation for laboratory-based nutritional status evaluation is alterations in pathophysiology that occur during periods of malnutrition. Numerous physiological adaptations take place when there is insufficient energy intake, including growth limitation, loss of fat, muscle, and visceral mass, a fall in basal metabolic rate, and a reduction in total energy expenditure [9,10]. Acute malnutrition causes biochemical alterations in the metabolic, hormonal, and glucoregulatory systems. Thyroid hormones, insulin, and growth hormone are the main hormones impacted. Triiodothyronine (T3), insulin, and insulin-like growth factor-1 (IGF-1) levels are decreased, whereas GH and cortisol levels are elevated. Glucose levels are frequently low and glycogen stores are poor. Rapid gluconeogenesis occurs early on and as a result of the utilization of amino acids, pyruvate, and lactate, skeletal muscle is lost as a result. When fat is mobilized during the phase of protein maintenance, it causes lipolysis and ketogenesis [11-13].
Common factors cited by the United Nations Higher Commission for Refugees (UNHCR) and other health organizations for the development of micronutrient deficiency and other forms of malnutrition include dependence on general food rations or lack of varied vegetables and fruits in the diet [7], Poor personal and environmental hygiene that makes a person more susceptible to developing infectious diseases and leads to problematic absorption of nutrients [8] and a history of non-communicable chronic diseases such as diabetes mellitus, hypertension, and others indirectly related to energy expenditure and other metabolic processes [14]. In addition poor economic and educational status, inadequate physical activity, psychological stress experiences related to living conditions, and underutilization of general food rations exacerbate the development of malnutrition in humanitarian crisis areas such as IDPs [11-13].
Although the WHO and Food and Nutritional Technical Assistant (FANTA) guidelines recommend anthropometric nutrition assessment as the main priority, they have also suggested that as it is also better to integrate other approaches to nutrition assessment, such as biochemical, clinical, and dietary assessments because they have a great tendency to provide detailed and efficient information about the causes of malnutrition and to facilitate a specific and earlier diagnosis of malnutrition [1].
Biochemical assessment of nutritional status includes measurement of laboratory parameters known to be related to nutritional chemistry, such as visceral proteins (albumin, total proteins), vitamins (vitamin B12, vitamin B9, vitamin A and D...), minerals (such as iron, zinc, iodine...) and various other parameters such as urea, lymphocyte count, transferrin, hemoglobin, C-reactive proteins, which have become more and more important in recent years [14,15].
The other major approach to nutrition assessment is anthropometric measurements, which includes measurements of height, weight, and mean upper arm circumference (MUAC) and others. In this approach, some of the measures are represented as indices, including height-for-age (HFA), weight-for-age (WFA), weight-for-height (WFH), MUAC-for-age and Body mass index-for-age (BMI-for-age). Each index is recorded as a z-score that describes how far and in what direction an individual's anthropometric measurement deviates from the median of the 2006 WHO Child Growth Standards for their sex. The remaining nutrition assessment approaches are clinical and dietary assessment approaches [1,16].
Since malnutrition has a multifactorial etiologic background, it requires the use of different types of nutrition assessment approaches to facilitate cost-effective intervention programs. Therefore, this study, tried to integrating anthropometric, biochemical, and dietary approaches to nutrition assessment, will be of utmost importance in providing scientifically sound information on nutritional status and factors associated with malnutrition among IDPs in Debark refugee camp, Ethiopia.
The study was conducted in Debark refugee camps in Debark town, North Gondar, Northwest Ethiopia. Debark town was located in the North Gondar Zone of Amhara National Regional State. The town is located 830 km away from Addis Ababa, the capital of Ethiopia, 277 km from Bahir Dar and 78 km from Gondar [17]. A cross-sectional study was conducted from March to May 2022.
The source population were all IDPs who have fled from their permanent residence area and were temporarily staying at the Debark refugee camp. All IDPs fled from their permanent residence area, who fulfils the inclusion criteria and living in debark refugee camp during sample collection period (from March 09 to May 13, 2022) were used as study population.
Inclusion criteria: All IDPs who have legal registration identification card and living at the time of data collection and who were voluntary to give their informed consent for the study were included in to this study.
Exclusions criteria: Those internally displeased individuals, who were on iron and vitamin supplementation, individuals with well-known clinical information of chronic illnesses like tuberculosis (TB), and chronic liver and kidney diseases were excluded from the study since these chronic illnesses have direct pathophysiologic effect on metabolism of nutrients. Individuals who were critically ill and unable to move without assistance and those pregnant women’s were also refrained from the study.
The sample size was calculated using single population proportion formula assuming the prevalence of underweight among under five age children as 29% from nationwide report of Ethiopian Demographic and Health Survey of 2011 with assumptions of 5% margin of error and 95% level of confidence [18]. Systematic random sampling techniques were used to recruit study participants in to the study. By considering the total number of Households living at Debark refugee camp as N = 1545 and the total study sample size n = 314, interval size (K) was calculated as K = N/n 1545/314 = 4.92 approximately 5.
Dietary diversity score: A qualitative measure of individual’s consumption of food varieties within last 24 hours. According to this an individual is considered to be on low dietary diversity score, if of consumption of food variety was one up to three, moderate dietary diversity score if consumption of variety of food was four up to five and on high dietary diversity if consumption varieties of food was greater or equals to six (≥ 6 food groups) [19].
Diarrheal disease: A clinical condition resulted from different ethological basis and known for the passage of three or more loose or liquid stools per day [20].
Educated person: A person at highest level of educational qualification or a person who was minimally on primary level of school and capable of reading, writing and retrieving of knowledge.
Malnutrition: A minimum of one unit index decrement on weight for height, height for age, weight for age below -2 SD of the median of reference population of were considered as wasted, stunted and underweight among children’s under the age of eighteen. For adults any deviation from WHO stated classification of BMI class were considered as malnutrition [21](1, 44, 45).
Perceived stress scale: A classic stress assessment tool used to measure how different situations affect ones feelings and results psychological stress. Scores ranging from 0-13 indicating low stress, scores ranging from 14-26 indicating moderate stress and scores ranging from 27-40 is considered as high perceived stress level [22].
Stunting: Height-for-age ratio of a child indicated by Z-scores of < -2 SD of the median WHO reference values [21].
Underweight: Child’s weight for age indicated by Z-score value less than < -2 SD from the median WHO reference values [21].
Wasting: MUAC measurement result < 125 mm for 6-59 month children, MUAC measurement < 145 mm for 5-9 years children, MUAC measurement result < 185 mm for 10-14 years children and MUAC measurement result < 220 for children age 15-17 years-old children [21].
Hypoalbuminemia: Serum concentration of albumin < 3.5 g/dl for all age group [23].
Low total protein concentration: Serum total protein concentration < 6-g/dl for all age group [23].
Folic acid deficiency: Serum folic acid concentration of < 2 ng/ml for adults and < 4 ng/ml for infant and < 5 ng/ml for children [23].
Vitamin B12 deficiency: Serum concentration of vitamin B12 < 180 pg/ml for all age group [23].
Hypoglycemia: Random blood sugar concentration of < 60 mg/dl for all age group [23].
Abnormal total cholesterol: Serum total cholesterol concentration of > 170 mg/dl for children and > 190 mg/dl for adults [23].
Normal serum iron concentration: For adults, children and infants were considered 49-167 ug/dl, 50-120 ug/dl, for and 40-100 ug/dl respectively [23].
Healthy weight range (normal): Adult BMI range of was considered ≥ 18.5 to < 25.0 [21].
Severe malnutrition: Adult BMI rang of < 16.0 [21].
Mild malnutrition: Adult BMI range of ≥ 16.0 to < 17.0 [21].
Moderate malnutrition: Adult BMI range ≥ 17.0 to < 18.5 [21].
Dependent variable: Nutritional status.
Independent variables
Socio-demographic variables
• Sex, age, marital status, duration in camp, educational status of participants, nearby care giver of children, family size and educational status of care giver.
• Biochemical parameters
• Concentrations of Total protein, albumin, total cholesterol, serum iron, glucose, folic acid, vitamin B12.
Dietary and feeding conditions
• Meal frequency, stapled food preference, dietary diversity, duration of food ration, inadequacy of food ration, breastfeeding status, status of complementary food utilization.
Personal and environmental hygiene status
• Main source of water, water treatment practice and type of mode of treatment, hand washing practice, bath taking and utensil washing practices, solid waste disposal system.
Clinical and health related conditions
• History us of repeated diarrheal disease, perceived stress conditions, status of contraceptive utilization.
Socio-demographic and other clinical and health related conditions: Socio-demographic characteristics of participants (such as sex, age, marital status, duration in camp, educational status of participants, nearby care giver of children, family size and educational status of care giver), dietary and feeding conditions (like meal frequency, staple food preference, dietary diversity, duration of food ration, inadequacy of food ration, breastfeeding status, status of complementary food utilization), as well as clinical and health related condition (such as history of non-communicable chronic disease, status of repeated diarrheal disease, perceived stress conditions, status of contraceptive utilization) were collected by face to face interview using structured questionnaire. The prepared questions was pre-tested at Kebero Meda - Azezo Gondor temporal refuge center to adapt to the local context based on the study objectives through face-to-face interview.
Anthropometric measurements: The data indicators used for anthropometry were age, height, weight and mid upper arm circumference (MUAC). The three summary indices of nutritional status: Weight for age (underweight), Weight for height (wasting) and Height for age (stunting) were used as per recommended by WHO. Children less than two-years-old were measured in recumbent position. On the other hand, height of the children who were more than two-years-old was measured by wood board stadiometer to the nearest and 0.1 cm. During height measurement the feet were at a 60 degree angle, slightly outward. The participant's shoes and hats were removed during the height assessment. Before weighing the study subjects, the weight scale was turn to zero. Then participants were asked to remove extra layers of clothing, shoes, jewelers and any items in their pockets.
Then 𝑍-scores of nutritional indices, such as weight-for-age (WAZ), height-for-age (HAZ) and weight for height (WHZ) was calculated using WHO anthro software (for children aged ≤ 5 years) and anthro-plus softwares (for children aged > 5 years). Finally, children were classified as stunted, underweight and wasted when the HAZ, WAZ and WHZ scores was less than -2 standard deviations (SD). Those all available data were collected by trained clinical nurses working in the camp.
Dietary assessment: Dietary status of IDPs were assessed based on individual’s dietary diversity assessment guidelines. Here in this assessment approach individual’s dietary utilization within the last twenty four hours were assessed using twelve food items. Next after taking participants response individual’s response were categorized into nine food items by categorizing similar food groups together. Based on this those IDPs score ranking one up to three, four up to five and six and above were considered as on low, moderate and high in diversity score respectively [19].
Laboratory determination of selected biochemical parameters: Those selected biochemical parameters were analyzed using Beckman coulter DxC 700 and Beckman Coulter DxI 800 Automated Chemistry analyzer and principle goes as follows. Total protein was determined depending on the principles of spectrophotometric measurements of color complex at 540/660 nm. Albumin was determined using the principle of Bromocresol green (BCG) assay method. Serum iron concentration was analyzed depending on the principle of spectrophotometric measurement of TPTZ [2,4,6-Tri-(2-pyridyl)-5-triazine] as the chromogen. Assessment of vitaminB-12 and Folate were executed following the principle of chemiluminescent immunoassay for the quantitative determination of respective analytes in serum sample. As well as Serum glucose level was determined using Hexokinase enzymatic assay method. Total cholesterol concentration was determined using enzymatic cholesterol esterase assay method.
Data quality control and management: The structured questionnaire was first translated from English to Amharic (local language) and this structured questionnaire was used among participants and pretest was conducted on 5% of the sample size outside of the study area at Azezo, Kebero Medda Temporal IDP camp; before the actual data collection was taken place. Training was given to data collectors about the objective and relevance of the study, confidentiality issues, study participant’s rights, consenting, techniques of interview and regarding laboratory tests procedures and their quality control. The blood sample collection and laboratory tests were performed by well-trained nurses and laboratory technologists. The collected samples were analyzed by Beckman coulter DxC 700 and DxI 800 chemistry analyzer, its quality was checked by previously documented Amhara regional state, Regional Laboratory and EQA sample result feedback reports.
Standard quality control (normal and pathological) protocols were performed and assured before run the participant's sample to assure the analytical performance, accuracy and functionality of the instrument. Furthermore, the investigator closely followed and frequently checked the sample analysis process to ensure the completeness and consistency.
Data analysis and interpretation : The data was checked for completeness, cleaned, arranged and categorized manually. Then, it was entered into EpiData version 4.6.0.6 and analyzed by SPSS 20 software. Descriptive statistics (frequencies, percentages, medians, minimum and maximum, interquartile range (IQR) were used to express socio-demographic and other characteristics. To measure the association between the dependent and independent variables chi square test, bi-variable and multi-variable logistic regression were used. Variables with a 𝑝 value less than 0.25 in the bi-variable analysis were fitted into the multi-variable binary logistic regression analysis to control the possible effect of confounding variables. Adjusted odds ratio (AOR) with the corresponding 95% confidence interval (CI) were calculated to measure the strength of association. Manny-Whitney U test was used to determine biochemical parameters differences in relation to nutritional status among different age class. Shapiro-Wilk test was used to test the normality of continuous variable whereas the model fitness was checked by Hosmer-Lemeshow test. Finally, in the multivariable analysis, variables with a 𝑝 value less than 0.05 were considered as statistically significant.
The study was conducted after ethical approval by the Research and Ethics Committee of the School of Biomedical and Laboratory Sciences, collage of Medicine and Health Sciences, University of Gondar. In addition, an official letter was sent to the administration of the study camp to enable the study to investigate nutritional status and associated factors using anthropometric and biochemical parameters among IDPs in Debark refugee camp, Ethiopia. Support letter was received from North Gondor, Debark zonal health bureau Before data collection began, data collectors were informed to ask permission and explain the purpose of the study, its importance and benefits; study participants were also offered to answer any questions to confirm their willingness. After explaining the purpose, benefits and possible risks of the study, written consent was also obtained from the caregivers of the study participant children. Participation in the study was also on a purely voluntary basis; refusal is possible. To ensure the confidentiality of the data, the study participants were identified by codes and only authorized persons had access to the collected data.
307 study participants with the median (IQR) age of 18 (6 month, 65 year) were included in our study with 97.7% response rate. The majority of the study participants were females (58%) and early adolescent children (10-14 years) (41%). The median (IQR) family size within household was 3 [1,9]. Regarding to duration in camp status, the median (IQR) duration was 5 months [1,10] (Table 1).
Table 1: Socio-demographic characteristics of study IDPs living at Debark Refugee camp, North Gondar, Ethiopia. 2021; (n = 307). View Table 1
Regarding to dietary management conditions, 37.5% (n = 115) participants were on low dietary diversity score and 30.6% (n = 94) of participants have responded as they use to sell the general food ration provided by health promoting organizations (Table 2).
Table 2: Dietary and feeding related conditions of IDPs living at Debark refugee camp, North Gondar, Ethiopia. 2022; (n = 307). View Table 2
Regarding to participant’s personal hygiene condition, majority of Participants 50.8% (n = 156) living in camp were found to depend on tanker water. A total of 34.5% (n = 105) participants had also responded as they use to exercise water treatment practice and utilization of chlorine treatment agent were found among majority of study participants accounting for 47.7% (n = 51). In addition, 34% (n = 105) participants were found exercising hand washing practice using only water (Table 3).
Table 3: Personal and environmental hygiene related conditions of IDPs living at Debark refugee camp, North Gondar, Ethiopia. 2021; (n = 307). View Table 3
Biochemical characteristics of participants: From a total 135 malnourished study participants low concentrations of albumin, total protein and folate accounts for 57%, 69.93% and 59.70 % respectively (Table 4).
Table 4: Biochemical characteristics of IDPs living at Debark refugee camp, North Gondar, Ethiopia. 2022; (n = 307). View Table 4
Of the total 307 study participants, 40% (n = 124) of the study participants reported having repeatedly suffered from diarrhea in the two weeks prior to the start of data collection. Of the participants in the age group twelve years and older who were selected for measurement stress using the perceived stress assessment instrument moderate stress accounts for 52% (n = 103), and high stress scores corresponds to 14.1% (n = 28) respectively (Table 5).
Table 5: Clinical and health related status of IDPs living at Debark refugee camp, North Gondor, Ethiopia. 2022; (N = 307). View Table 5
Based on global anthropometric classification standard the overall prevalence of malnutrition among the whole participants were 44% (n = 135) (95% CI: 38.7, 49.8). The prevalence of stunting, wasting and underweight among under five children were 34.88%, 41.12% and 30% respectively (Figure 1).
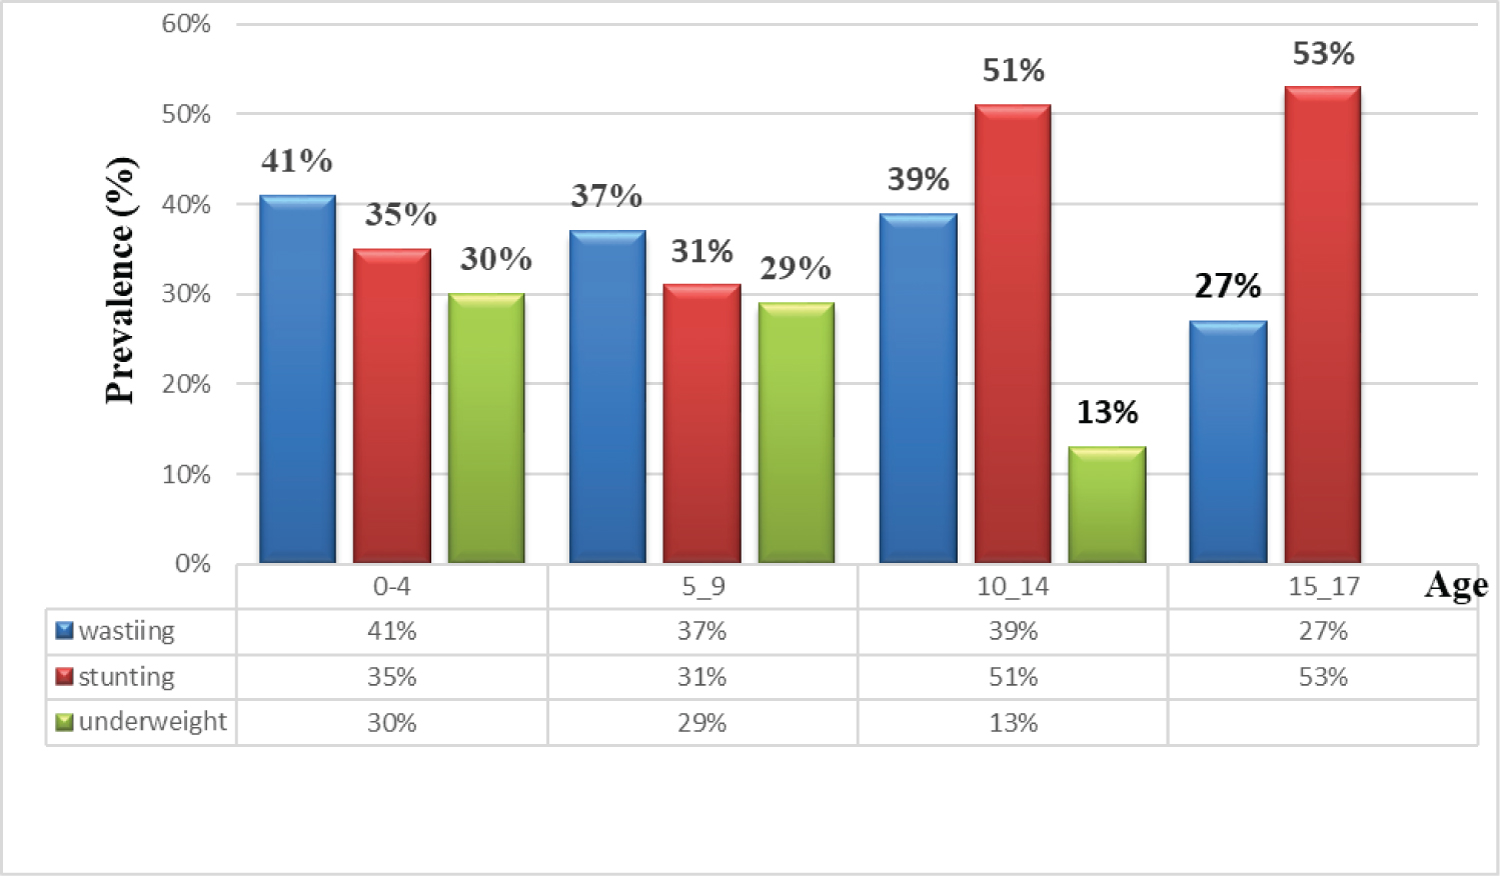 Figure 1: Nutritional status of children bellow the age group of eighteen living at debark refugee camp, North Gondar, Ethiopia. 2022; (n = 307).
View Figure 1
Figure 1: Nutritional status of children bellow the age group of eighteen living at debark refugee camp, North Gondar, Ethiopia. 2022; (n = 307).
View Figure 1
Regarding to nutritional status of adults, considering majority of participants living in Debark refugee camp were on normal BMI score (accounting for 75.5% (n = 120) and followed by mild malnutrition weighting for 11.3% (n = 18) (Figure 2).
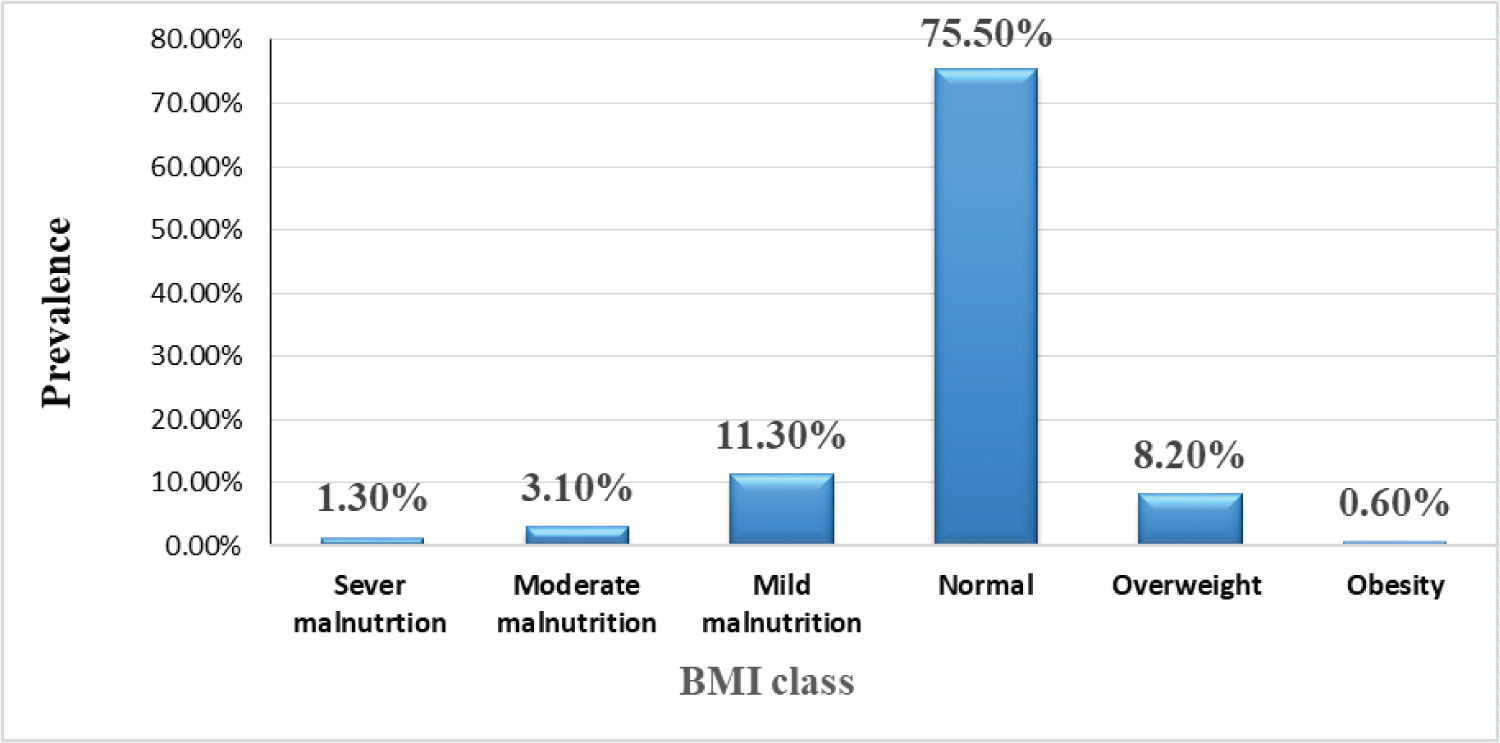 Figure 2: Nutritional Statues of Adult IDPs Living At Debark Refugee Camp, North Gondar, Ethiopia. 2022; (n = 307) based on BMI classification scheme.
View Figure 2
Figure 2: Nutritional Statues of Adult IDPs Living At Debark Refugee Camp, North Gondar, Ethiopia. 2022; (n = 307) based on BMI classification scheme.
View Figure 2
In order to assess degree of difference between biochemical parameters and nutritional statuses of children and adults Manny-Whitney U test was performed. Under this test there were statistically significant median (IQR) value differences among children age group bellow eighteen on the measurement of albumin, total cholesterol, total protein and glucose parameters, which were found to be expressed by effect size (r = Z/√n) values of 0.215, 0.123 ,0.139 and 0.170 respectively (Table 6).
Table 6: Comparison of nutritional status of IDPs using selected biochemical parameters among study participants at Debark refugee camp, Northern Gondor, Ethiopia; 2022 (n = 307). View Table 6
Bivariate logistic regression analysis was done and variables below p-value 0.25 were analyzed under multivariate logistic regression to exclude the effect of confounding variables. In multivariate logistic regression analysis, the odds of being malnourished was increased by 3.7 (95% CI; 95% CI: 1.3, 9.9) folds among individuals with low dietary diversity score as compared to their counter parts. Being uneducated increased the odds developing malnutrition by 3.1 (95% CI; 1.09, 8.2) factors as compared to the educated ones. The odds of malnutrition was increased by 3.7 (95% CI; 1.3, 9.8) folds among individuals with repeated diarrheal disease compared to their counterparts. The odds of being malnourished was 3.5 (95% CI; 1.04, 11.58) folds among individuals with high perceived stress score as compared to individuals on low stress status. The odds of being malnourished were also found 7.3 (95% CI; 2.7, 19.2) fold among individual with low concentration of total protein, 3.1 (95% CI; 1.1, 8.5) fold among low serum albumin concentration and 3.1 (95% CI; 1.07, 9.05) fold among low folic acid concentration as compared to their counter parts (Table 7).
Table 7: Factors associated with malnutrition among study participants in bi variable and multi variable logistic regression analysis. View Table 7
In the present study the overall prevalence of malnutrition was 44% (95% CI: 38.4, 50.2). Out of this wasting, stunting and underweight among under five children accounts for 41.86%, 34.88% and 30% respectively. This prevalence is above the threshold limit set by FANTA which were wasting ≥ 15%, Stunting, ≥ 40% and underweight ≥ 30% [21]. The burden of malnutrition was considered as very high public health concern. The potential reasons for higher prevalence of malnutrition among children were majorly being on crucial life period requiring quality full nutrient for body and mental growth, reduced adaptive response to hunger and unable to stand by themselves as an autonomous for their nutritional requirement and care [22,23]. Previous studies have also shown that IDPs and refugees were at high risk of developing malnutrition through recent devastated increment of man-made and natural disasters [24,25].
In the present study, the Prevalence of stunting among under five children was 35% (95% CI: 23.3, 51.2). This result was comparable to study conducted at kebribeyah refugee camp, Somalia Ethiopia (29.65%) [1] and Adi Harushi and Hitsatsi refugee camps in Ethiopia (37%) [2]. The prevalence of underweight 30% (95% CI: 14.1, 42.5) was also comparable with studies conducted in Kebribeya refugee camp (26.8%) and Adi harushi and Hitsasi refugee camps (21.6%). In addition the prevalence of wasting among under five children in the present study was 41% (95% CI: 27.8, 45.9) which was in line with Kebribeyah refugee camp report (29.65%) and Adi Harushi and Hitsasti refugee camp (37%).
The prevalence of wasting in this study was higher than study conducted among adolescent refugees living in Peshawar Pakistan wasting 35.3% [11]. The potential reason for this higher proportion of wasting prevalence might be due to IDPs prolonged duration within the camp, nature of the study or inclusiveness of the whole age group, existence of diarrheal diseases, poor socioeconomic and nutritional managements. However, our study was lower than the study conducted in aforementioned study area, in terms of prevalence of overweight (44%) and obesity (14.8%). Genetic factors, environmental factors, nutritional management conditions might be the potential reasons for these numbers.
In addition, the prevalence of Vitamin B12 deficiency and folate deficiency, which was 44% (95% CI; 38.0-49.3) and 21.8% (95% CI; 16.6-26.1) in our study was comparable with the study conducted Peshawar, Pakistan, Khazana refugee camps (41.9%) and (28.2%) respectively [11]. This might be due food dependency and similarities of general food ration provided by health promoting organization. Since majority of the general food ration provided across the world was not considered as fully enriched in all micro nutrients and the main emphasis in the preparation of this food ration is on caloric composition rather than micronutrients [26,27]. The finding of vitamin B12 deficiency in our study was also higher than a study conducted among newly arriving Refugees from Bhutan, Iran and Afghanistan in Australia (16.4%) [28] and newly arriving refuges in waterloo, Ontario Canada (11.2%) [29]. The possible reason for this discrepancies for the present study were longer camp duration, sociodemographic factors, economical setbacks to afford vitamin rich vegetables and fruits and low literacy rate.
In the Manny-Whitney U test, our finding shows as there were significant difference in median (IQR) concentration of albumin (P = 0.015), total protein (< 0.001), total cholesterol (P = 0.03) and serum glucose (P = 0.031) among malnourished IDPs, which were found to be lower as compared to non-malnourished IDPs. In this test since all the parameters listed in the above were found to have effect size (r) value bellow 0.3 which was considered to be on small difference. The median concentration differences on biochemical parameters were also restricted majorly among under eighteen children. Indicating susceptibility of individuals from this age group for development of malnutrition and higher portion of prevalence among this age group. The results were also indicative of effect of aging on screening efficiency of some parameters since some visceral proteins tend to decrease through aging [14].
The findings of this studies was supported by a case control study conducted at Gujarat, India, in which the mean concentration of total protein, albumin and ratio of albumin/globulin were found to be lowered among cases as compared to the controls p < 0.001 [30]. Our findings are also supported by studies conducted in Magaria District, Zinder, Niger Republic which indicates as there was overt difference in biochemical parameters among malnourished individuals and the counterparts in terms of total protein and serum albumin concentration which tends to extremely decrease with increasing severity of malnutrition. Both studies mentioned in the above were also witnessed that the observed difference in those listed biochemical parameters were majorly distributed among children as compared to adults. The possible reason behind little difference in the median concentration of albumin among malnourished and their counterparts were primarily due to age factors, since the concentration of albumin among older peoples tends to decrease through aging.
In the present t study low concentrations of albumin (AOR = 3.0, 95% CI: 1.13-8.5) and low total protein concentration (AOR = 7.3, CI = 2.7-19.2) have shown significant independent association with malnutrition. Even if establishing cause and effect relationship was difficult in these biochemical parameters and malnutrition, it’s known that consuming diets lacking essential proteins like albumin, globulins and other might results malnutrition. The main mechanisms by which deficiencies of these proteins cause malnutrition are through causing defective transportation of micronutrients like vitamins that are essential for cell differentiation maturation and growth , increased susceptibility to infection and impaired passage of water and solutes within the capillaries or vasculatures [31,32].
Low levels of visceral proteins like total protein and serum albumin are reflective of decreased macronutrients intake specifically protein, low hepatic production or protein loss from the vascular component and generalized impaired biosynthesis process [27]. The albumin concentration in the body is influenced by the quality of nutrition and albumin from the extravascular pool can be mobilized during periods of protein depletion resulting from the stressful events like malnutrition and infections. However, the concentration tends to remain constant for long period of time. This was one of the core reasons that makes albumin as the good indicator of long-term protein and energy deprivation. Therefore it helps to identify chronic protein deficiency under conditions of adequate non-protein calorie intake, which leads to marked hypoalbuminemia [33]. When we link this in to the findings of our study, the observed hypoalbuminemia 34.9% (95% CI: 29.3-39.5) in our study might be due to lack of consumption of protein rich diets and existence of infectious diseases which were hugely associated with poor personal hygiene and environmental sanitary exercise; things which were prevalently seen among IDPs living at Debark refugee camp.
The odds of developing malnutrition was increased by 3.1 folds among folic acid deficient IDPs as compared to their counterparts. The possible mechanism were through impaired oxygen transport, impaired cell division, dysregulated methylation process of gene expression, decreased stimulation of red blood cells (RBC), white blood cells (WBC) and platelets production, reduced immune response and accumulation of homocysteine.
High stress conditions increases the odds of developing malnutrition by 3.5 (95% CI: 1.04-11.58) folds as compared to individuals with low stress status. The core reason behind this was, increased release of cortisol [17,34], increased metabolic stimulation of adrenaline hormone [35,36], reduced action of leptin hormone, promoted response of ghrelin hormone and impaired sleep cycles which is known for promoting satiety while increasing the hormone ghrelin [36,37].
In this study IDPs on low dietary diversity score were found 3.7 (95% CI: 1.37-9.98) more likely to be malnourished as compared to IDPs on high dietary diversity score. The main reason behind being on low dietary diversity (consuming only 1 up 3 types of food items in last 24 hours) and developing malnutrition were majorly due to economic instability and lack sufficient knowledge on nutritional management. The major mechanisms by which low dietary diversity causes malnutrition includes through impaired immunity, reduced cellular development and maturation, negative energy balance, loss of fluid balance, reduced appetite, increased gluconeogenesis, impaired enzymatic process and impaired intercellular degradation of fatty acids [14,38-40].
In this study having repeated diarrheal disease within last two weeks was found to increase the odds of developing malnutrition by 3.7 folds (95%, CI: 1.36, 9.82) as compared to their counterparts. The main mechanism behind the effect of diarrheal disease on malnutrition was through reducing food appetite, energy intake, nutrient loss, and mal-absorption and also through fluid loss accompanied by drastic weight loss [30,41,42]. Since majority of inhabitants in this IDP camp have exercising poor personal and environmental sanitation practice they have easily developed diarrheal diseases 40.4% (95% CI: 35.1-46.3).
According to our study the odd of having malnutrition increases by 3.1 folds (95% CI: 1.09, 8.2) among uneducated as compared to those educated IDPs living within a camp. This is majorly due to significance of education in managing dietary system and keeping personal and environmental sanitation, since the quality of life is strongly associated with intellectual status of individuals.
To the best of our knowledge and searching effort, this was the first study to assess the nutritional status of IDPs in refugee camps of Ethiopia, combining several biochemical parameters with anthropometric measurements. The study was also highly eager to show nutritional status of the whole age group IDPs living in Debark refugee camp the following outbreak of conflict between the Tigray armed forces and the Ethiopian central government. The results of the study were also believed to serve as a blue print through showing the real burden of malnutrition and facilitating efficient and effective humanitarian response. The cross-sectional nature of this study was the first limitation. Because cross-sectional study design does not allow to establish a cause and effect relationship. The second drawback of this study was lack of incorporating clinical based nutritional assessment approaches, since the study was known for integrating only anthropometric, biochemical and dietary assessment approaches. The study also didn’t include those refuges outside of the camp even if they have legal registration.
Our findings shown that malnutrition was a major health problem among IDPs in Debark refugee camp. The micronutrient deficiencies such as folic acid and vitamin B12 deficiency were also seen prevalently among inhabitants of Debark refugee camp. It was concluded that as the findings of biochemical parameters have great importance, since the findings of biochemical parameters were have shown significant association with nutritional statuses of IDPs. There were significant association between low dietary diversity, high levels of stress, recurrent diarrhea, low literacy rates, and low concentrations of folic acid, total protein, and albumin with malnutrition.
Targeted interventions and strategies for IDPs, especially in conflict areas, should be planned to alleviate problems related to malnutrition, as refugee camp residents are particularly vulnerable. It is also better to carry out regular assessment of biochemical parameters in conjunction with routine anthropometric measurements. In addition to these nutritional expert inclusive periodic screening of nutritional status need to be mandatory practice through integrating the four nutritional assessment approaches “ABCD” (Anthropometric, Biochemical, Clinical and Dietary assessments). Facilitating education with regard to dietary management system and personal and environmental sanitation practice among inhabitants of refugee camp should also need to be applied. It is also advisable to facilitate the way in which IDPs receive additional nutritional assistance from governmental and non-governmental organizations, as food dependency in this camp is too high. Furthermore, periodic counseling of IDPs with regard to their living situations and psychological status through psychiatric professionals and experts are advisable.
AOR: Adjusted Odd Ratio; BMI: Body Mass Index; CI: Confidence Interval; COR: Crude Odd Ratio; EDHS: Ethiopian Demographic and Health Survey; FANTA: Food and Nutrition Technical Assistance; HFA: Height for Age; IDMC: International Displacement Monitoring Counsel; IDP: Internally Displaced Person; IQR: Inter Quartile Range; MUAC: Mid Upper Arm Circumference; PEM: Protein Energy Malnutrition; SD: Standard Deviation; SOP: Standard Operating Procedure; UNHCR: United Nation Higher Commission for Refuges; WFA: Weight for Age; WFH: Weight for Height and WHO: World Health Organization
Conceptualization: Mahder Girma; Data Collection: Mahder Girma, Alemie Fentie, Mahider Shimelis, Bruktawit Eshetu, Rishan Hadgu, Abebe Yenesew, Zeleke Kassahun, Bisrat Birke, Woyesa Boyne, Fitsum Abebe, Menber Wubete; Formal analysis: Mahder Girma, Elias Chane, Amare Mequanint; Investigation: Mahder Girma; Methodology: Mahder Girma; Resources: Mahder Girma; Supervision: Mahder Girma, Habtamu Wondifraw, Abebaw Worede, and Alebachew Fasil; Writing – original draft: Mahder Girma; Writing – review & editing: Mahder Girma, Habtamu, Wondifraw and Abebaw Worede; Disclosure: All authors have read and approved the final manuscript.