Background: There is still an urgent need for precise biomarkers for predicting the clinical outcome of anti-EGFR antibody treatment for metastatic colorectal cancer. We hypothesized that transcriptome signatures might act as a more effective biomarker beyond RAS mutations and anatomic sites. This study was undertaken to develop a transcriptional score predictive of benefit of anti-EGFR antibodies for RAS wild-type metastatic colorectal cancer.
Methods: The Gene Expression Omnibus (GEO) dataset GSE5851 was used to develop the Integrated Pathway Score (IPS) through a penalized logistic regression model. The performance of the IPS was verified with the validation set GSE104645 by using a Kaplan-Meier curve, time-dependent ROC analysis and Cox regression. The impact of chemotherapy and bevacizumab on the IPS was evaluated using tumor tissue from GSE41568.
Results: A total of 3 pathways were identified in the final binary classifier for predicting disease control after cetuximab treatment in GSE5851. The median value of the scaled IPS was -0.0646 (IQR: -0.747-0.719), and the AUC was 0.937 for discriminating patients who achieved disease control from those with progressive disease. In the validation set GSE104645, the IPS in the patients who achieved partial response and stable disease was significantly higher than those with progressive disease (adjusted P = 1.547 × 10⁻⁴, P = 0.0158). The IPS was not an independent predictive factor for objective response (OR = 1.417, 95% CI: 0.703-2.859, P = 0.33). Nevertheless, only the anti-EGFR treatment pattern (combined with chemotherapy versus monotherapy) (HR = 0.439, 95% CI: 0.256-0.755, P = 0.003), DNA methylation status (LMCC vs. HMCC: HR = 0.361, 95% CI: 0.188-0.696, P = 0.002; Unparsed vs. HMCC, HR = 0.398, 95% CI: 0.196-0.806, P = 0.010) and the IPS (HR = 0.748, 95% CI: 0.573-0.976, P = 0.032) were independent prognostic factors for PFS when adjusted for consensus molecular subtypes and other gene signatures. In addition, the IPS appeared to decrease in liver metastatic tissues after chemotherapy and bevacizumab treatment.
Conclusion: The IPS may be useful to guide the use of anti-EGFR antibody treatment options. The transcriptional profile from the tumor microenvironment may be a more important indicator of the long-term benefit of anti-EGFR antibodies.
Colorectal cancer, Tumor biomarkers, Cetuximab, Gene expression signature
mCRC: Metastatic Colorectal Cancer; CMS: Consensus Molecular Subtypes; DEG: Differentially Expressed Genes; GSEA: Gene Set Enrichment Analysis; IPS: Integrated Pathway Score; ROC: Receiver Operator Characteristics Analysis; BS: BRAF Score; MPAS: MAPK Pathway Activity Score; CYT: Cytolytic Activity; AUC: Area under The Receiver Operating Characteristic Curve
Metastatic Colorectal Cancer (mCRC) is a systematic and complicated disease; thus, accurate classification and combined treatments are necessary to achieve superior clinical benefits. Anti-EGFR antibodies, such as cetuximab, are efficient therapeutics for mCRC patients without RAS oncogene-activated mutations. Further clinical research suggested that cetuximab is more suitable for left-sided mCRC than right-sided mCRC [1]. Moreover, only a fraction of patients manifested responsiveness, mainly because of intrinsic resistance mechanisms beyond RAS mutations due to tumor heterogeneity [2].
At present, tumor molecular subtyping based on mRNA expression profiles is a promising method for understanding tumor heterogeneity. Several previously published studies have revealed that molecular subtyping can better capture different CRC characteristics. Bramsen, et al. reported a model of classification of CRC encompassing 5 tumor archetypes [3], and Isella, et al. focused on intrinsic transcriptional features of cancer cells [4]. In addition, Consensus Molecular Subtypes (CMSs) provide an integrated framework to depict the intrinsic heterogeneity of CRC [5]. Molecular subtyping sheds light on the possible molecular mechanisms underlying the biological characteristics of each molecular subtype and therefore paves the way to better anticancer therapy for affected individuals. The results from the CALGB/SWOG8045 (Alliance) trial demonstrated that CMS classification is an independent prognostic factor and may be a predictive factor in patients with mCRC who undergo treatment with first-line targeted therapeutics [6]. Nevertheless, CMS classification wasnot originally designed to be a biomarker predicting the benefit of anti-EGFR antibodies or anti-angiogenesis antibodies. A further specific strategy to develop a more accurate molecular signature for anti-EGFR antibody benefit prediction is warranted.
We hypothesized that transcriptome signatures might act as a more effective biomarker to guide the utility of anti-EGFR antibody treatment form CRC. To this end, we constructed a transcriptional scoring system, the Integrated Pathway Score (IPS), for predicting anti-EGFR antibody benefits. The development of the IPS was based on both the tumor microenvironment and intrinsic tumor cell characteristics for the purpose of identifying aspecific population of RAS Wild-Type (WT) mCRC patients that would benefit from anti-EGFR antibody therapy. Our results indicate that that IPS may represent another useful tool to guide the choice of therapeutic options.
Series matrix files for GSE5851, GSE104645 and GSE41568 were downloaded from the Gene Expression Omnibus (GEO), which provided the gene expression matrixes and phenotype files used in this study. Important clinical information, such as chemotherapeutic regimen, responsiveness to biologic therapies (anti-EGFR monoclonal antibodies cetuximab and panitumumab or anti-angiogenesis monoclonal antibody bevacizumab), RAS and BRAF mutation status and progression-free survival and overall survival, was obtained from originally published articles or from the series matrix files [7-9]. The retrieved clinical information and details of these three datasets are shown in Supplementary Table 1. The gene expression profiles at the probe level for GSE5851 and GSE41568 first showed median normalization. A single probe with the highest variation was selected for those genes with multiple probes in each of the datasets and annotated with the corresponding annotation file according to the type of microarray platform. A total of 12101 overlapping genes across three gene expression matrixes were retained for further analysis.
Table 1: Predicting sensitivity of CMS classification and IPS for response rate of anti-EGFR treatment in GSE104645. View Table 1
The integrated pathway score potentially predicting the benefit of anti-EGFR monoclonal antibodies was developed with GSE5851 by using a method similar to that described by Bramsen. Differentially Expressed Genes (DEGs) between disease-controlled cases (patients who achieved partial response and stable disease, PR+SD) and non controlled cases (patients who experienced progressive disease, PD) were identified by linear regression with the R package "limma". Gene Set Enrichment Analysis (GSEA) was used to assess differences in biological characteristics between the disease-controlled cases and non-controlled cases by using DEGs with crude a P value < 0.05 as the gene list and C2 curated gene sets from the MSigDB collections (http://software.broadinstitute.org/gsea/msig db/genesets.jsp?collection=C2) as test gene sets through the "GSEA" function of the R package "cluster Profiler" [10]. The significantly enriched pathways were identified by setting the cutoff value of adjusted P < 0.1, generated from the Benjamini and Hochberg correction method for multiple comparisons. Among the core genes enriched in each significant pathway, the difference between the average expression of DEGs that were downregulated and the average expression of DEGs that were upregulated was calculated as a pathway score for each significant pathway. The pathway scores for ten significant pathways in each dataset are shown in Supplementary Table 1. A binary classifier for discriminating disease control from PD based on logistic regression using all pathway scores as independent covariates via penalized maximum likelihood in the R package "glmnet" was developed to obtain the coefficient of pathway scores significantly contributable to the binary classifier. A weighted linear score, namely, the Integrated Pathway Score (IPS), was calculated by summing all significant pathway scores weighted by their coefficients. The IPS in each dataset was separately scaled for further statistical analysis. The cutoff value of the IPS was determined through receiver operator characteristics analysis (ROC) to discriminate disease-controlled cases from non controlled cases in GES5851. Patients with IPSs lower than and higher than the cutoff value were categorized into the low IPS and high IPS groups, respectively.
Four consensus molecular subtypes (CMS1-4) were determined inGSE5851 and GSE41568 by using the main function "classify CMString" in the R package "CMString" developed by Robert Piskol, in which the parameter "thresh" was set to 0.5 [11]. Four other gene signatures that may be able to predict the benefit of anti-EGFR antibody treatment were calculated according to methods described in original articles with some modifications [2,12-14]. The BRAF Score (BS) was calculated foreach dataset with 17 pairs of genes from 32 originally defined pairs of genes, shown in Table 1, within a previously published article because only these genes overlapped with the 12101 genes shared among thethree datasets. The MAPK Pathway Activity Score (MPAS) was calculated for each dataset according to the previously published method. Cytolytic activity (CYT) was calculated by averaging the gene expression levels of GZMA and PRF1 [13]. The BATF3+ DC score was generated by averaging the expression levels of BATF3, IRF8, THBD and CLEC9A [14].
A portion of patients enrolled in GSE104645 had been treated with cetuximab or panitumumab alone or in combination with various second-line chemotherapies [8]. These 94 patients with wild-type RAS comprised the validation set. All 94 patients who underwent anti-EGFR monoclonal antibody treatment had records in terms of progression-free survival and overall survival, 91 of whom had response evaluations. Forty-three patients treated with bevacizumab and 51 patients treated with chemotherapy alone as the first line treatment were also used to evaluate the association between the IPS andPFS to assess the predictive ability ofthe IPS for anti-EGFR treatment benefit.
GSE41568 contained the mRNA expression profiles of 39 samples resected from liver metastases of colorectal cancer. Of these, 11 patients had received oxaliplatin-based therapy (some in combination with bevacizumab) prior to liver resection, and the other 28 had received no treatment before surgery. These patient data were used to evaluate the impact of oxaliplatin-based systemic therapy on the IPS.
A Chi square test or Fisher's exact probability was used to compare response rates or disease control rates in different CMS subtypes as well as between low and high IPS subgroups. The Kruskal-Wallis test with Bonferroni correction for multiple comparisons was used to evaluate differences in the distribution of the IPS among different clinic opathological characteristics. Univariate and multivariate logistic regression analyses were used to evaluate factors independently associated with response and disease control. The Kaplan-Meier method and a log rank test were used to assess differences in the PFS rate among different MCS subtypes or between the low and high IPS subgroups. Univariate or multivariate Cox proportional hazards regression analyses were used to identify independent prognostic factors associated with PFS or OS. The Area Under the receiver operating characteristic Curve (AUC) was determined by DeLong's method. The prognostic efficiency of CMS, BS, MPAS and the IPS for PFS and OS after anti-EGFR treatment in the validation set was determined with time-dependent ROC curve analysis by using the function "timeROC". Comparison between two time-dependent AUCs was performed with the function "compare" in the R package "timeROC" (version 0.3 published in 2015-03-25) [15]. The consensus index of CMS, BS, MPAS and the IPS for PFS and OS after anti-EGFR treatment in GSE5851 and the validation set was evaluated by using the R package "survcomp" [16]. All other statistical analyses were performed using SPSS 17.0 (IBM SPSS, Chicago, IL, USA). All tests were bilateral, and P < 0.05 was considered statistically significant. The statistical methods of this study were reviewed by He Xiao from Department of Cancer Center, Daping Hospital, Army Medical University.
Information on patient responsiveness to cetuximab monotherapy was available for 68 patients in GSE5851. A total of 1025 DEGs with a crude P value of < 0.05 were identified between disease-controlled cases (n = 25) and non controlled cases (n = 43). GSEA revealed that only 10 pathways among the canonical pathways of C2 gene sets were significantly enriched based on these DEGs (Supplementary Table 2A and Supplementary Table 2B). Only 3 pathway scores, namely, REACTOME_SLC_MEDIATED_TRANSMEMBRANE_TRANSPORT, REACTOME_DEVELOPMENTAL_BIOLOGY, KEGG_CYTOKINE_CYTOKINE_RECEPTOR_INTERACTION, significantly contributed to the binary classifier for predicting disease control (Supplementary Table 2B). The median value of the scaled IPS in these 68 cases was -0.0646 (IQR: -0.747-0.719). Patients who achieved disease control exhibited a significantly higher IPS than those with PD (median (IQR): 1.223 (0.678-1.390) vs. -0.558 (-1.169-(-0.596)), P < 0.001). The AUC was as high as 0.937 for discriminating patients who achieved disease control from those with PD (Figure 1A). In the subgroup with wild-type KRAS expression (n = 37), in which 17 progression events were observed, the IPS strongly predicted disease control based on a cutoff value of 0.446 for the IPS (Table 2). More importantly, the IPS could also predict disease control in the subset of CMS1/3/4 patients that had a suboptimal response to cetuximab (Table 2). The difference in the PFS rate was more pronounced between subgroups with high and low IPS than in those stratified by the CMS classification (Figure 1B and Figure 1C). Only the IPS was an independent prognostic factor (HR = 0.459, 95% CI: 0.250-0.843, Wald P = 0.012) for PFS adjusted for BS and CMS classification (CMS2 vs. CMS1/3/4) in these patients. Moreover, time-dependent ROC analysis demonstrated that the IPS had the highest AUC out of all of the gene signatures (Supplementary Figure 1).
 Figure 1: Characteristics of IPS developed in GSE5851 (A) ROC curve showing capacity of IPS for discriminating disease controlled cases from none-controlled cases; (B) Progression free survival curves showing significantly different PFS between patients with low and high IPS; (C) Progression free survival curves of patients stratified by the CMS classification.
View Figure 1
Figure 1: Characteristics of IPS developed in GSE5851 (A) ROC curve showing capacity of IPS for discriminating disease controlled cases from none-controlled cases; (B) Progression free survival curves showing significantly different PFS between patients with low and high IPS; (C) Progression free survival curves of patients stratified by the CMS classification.
View Figure 1
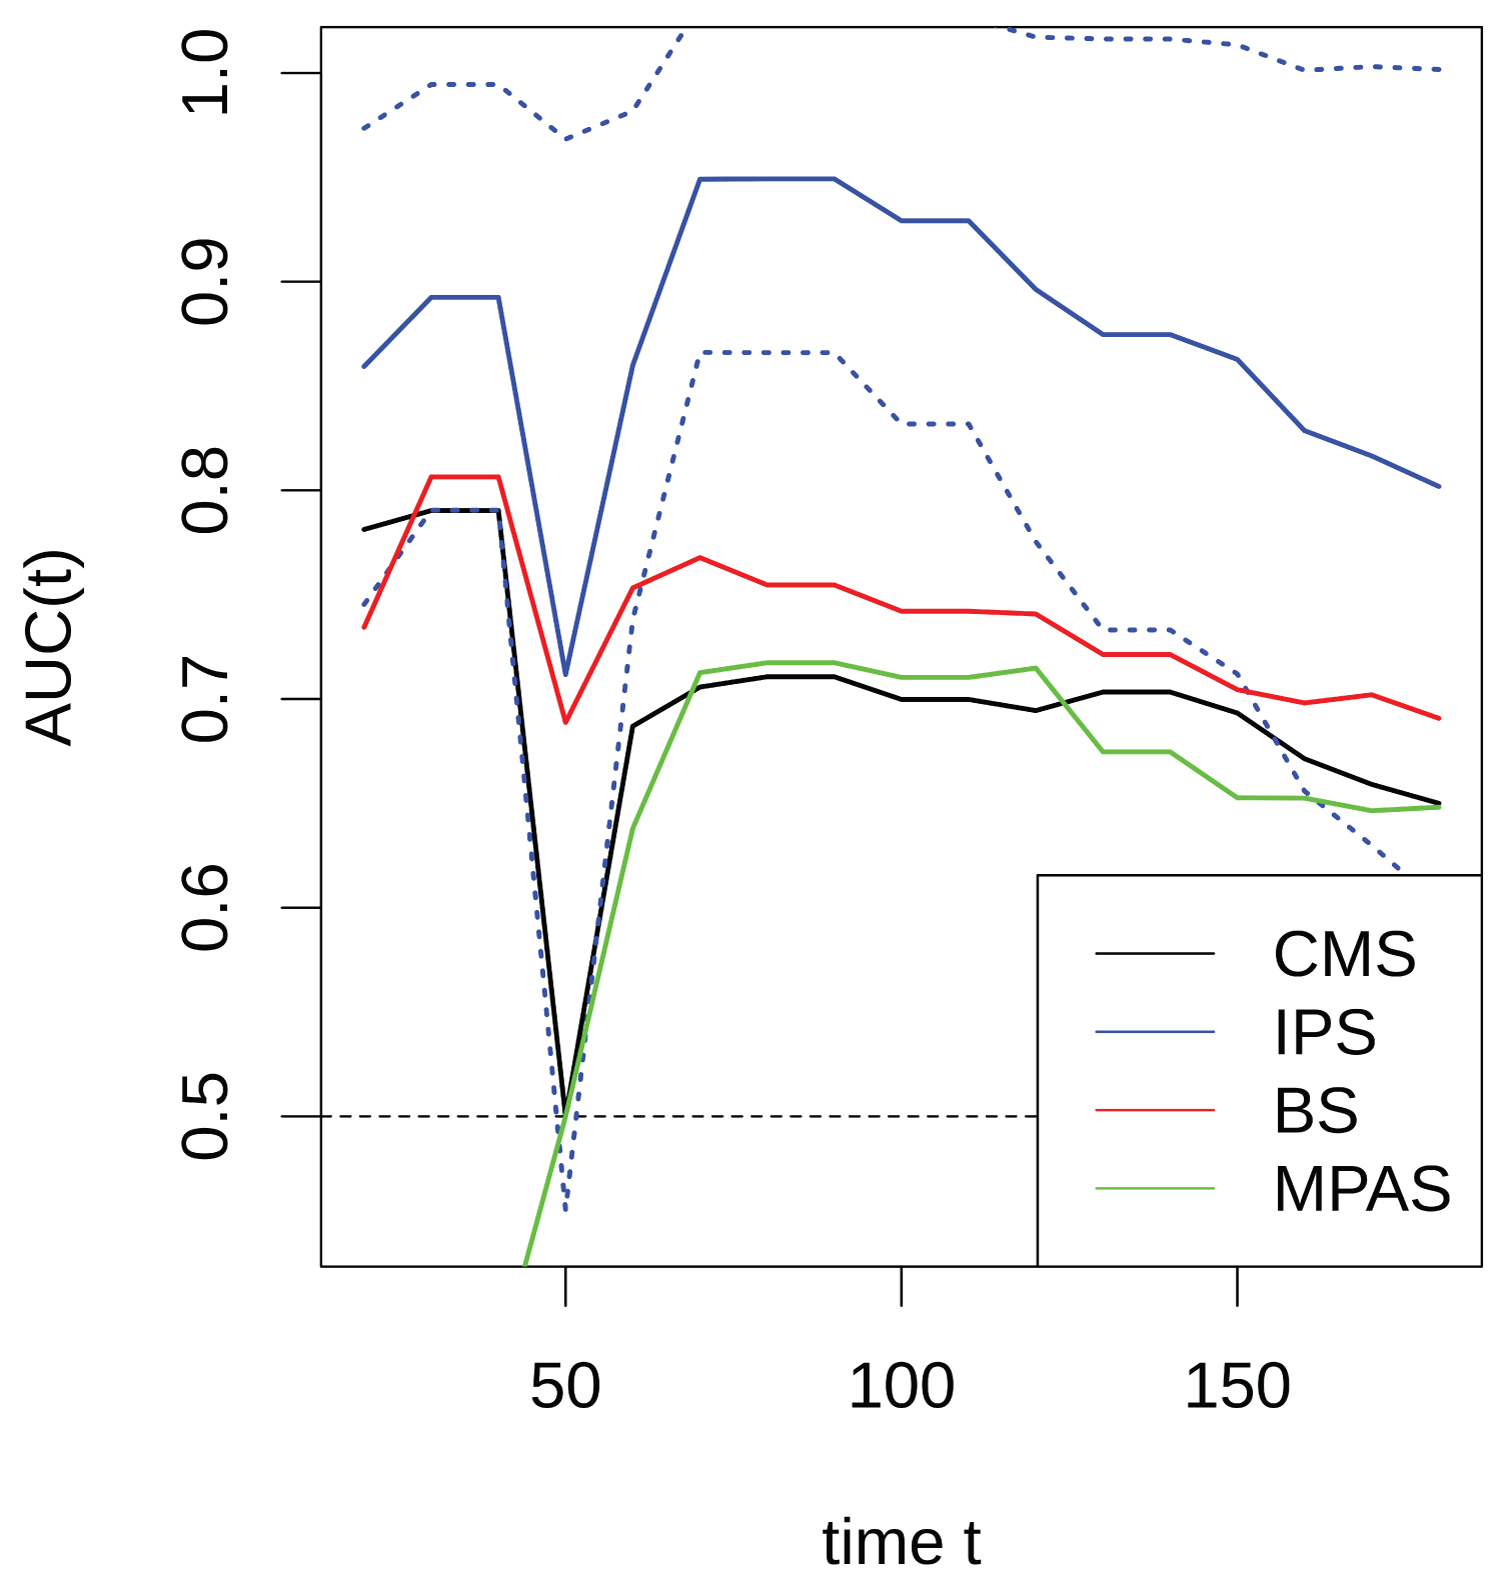 Supplementary Figure 1: Curves plots showing AUCs of IPS, BS, MPAS and CMS [CMS2 vs. CMS1/3/4] determined in the various time points for the prognostic accuracy of PFS for patients with wild type RAS in GSE5851.
View Supplementary Figure 1
Supplementary Figure 1: Curves plots showing AUCs of IPS, BS, MPAS and CMS [CMS2 vs. CMS1/3/4] determined in the various time points for the prognostic accuracy of PFS for patients with wild type RAS in GSE5851.
View Supplementary Figure 1
Table 2: Predicting sensitivity of CMS classification and IPS in GSE5851. View Table 2
The median value of the scaled IPS of the validation set was 0.347 (IQR: -0.594-0.989). The IPS was significantly different among CMS subtypes (P = 3.009 × 10⁻⁶ Supplementary Figure 2A). In the entire population with response evaluations available, the IPS in the patients who achieved PR and SD was significantly higher than that in those with PD (adjusted P = 1.547 × 10⁻⁴, P = 0.0158 Supplementary Figure 2B). The IPS and CMS classification system had comparable discriminating capacities for objective response rate and disease control rate (Table 1 and Table 3). However, it was observed that in the subset of CMS1/3/4, the disease control rate was significantly higher in patients with high IPS; the response rate was also higher in patients with a high IPS, but had borderline significance, and both the disease control rate and response ratewere diminished in the CMS2 subset (Table 1 and Table 3). Although ROC analysis illustrated the comparably high efficiency of the IPS and BS for predicting both objective response and disease control, which were both dramatically superior to that of the CMS classification, only BS and MPAS were independent predictive factors for objective response, as revealed by multivariate logistic regression (Figure 2 and Supplementary Table 3).
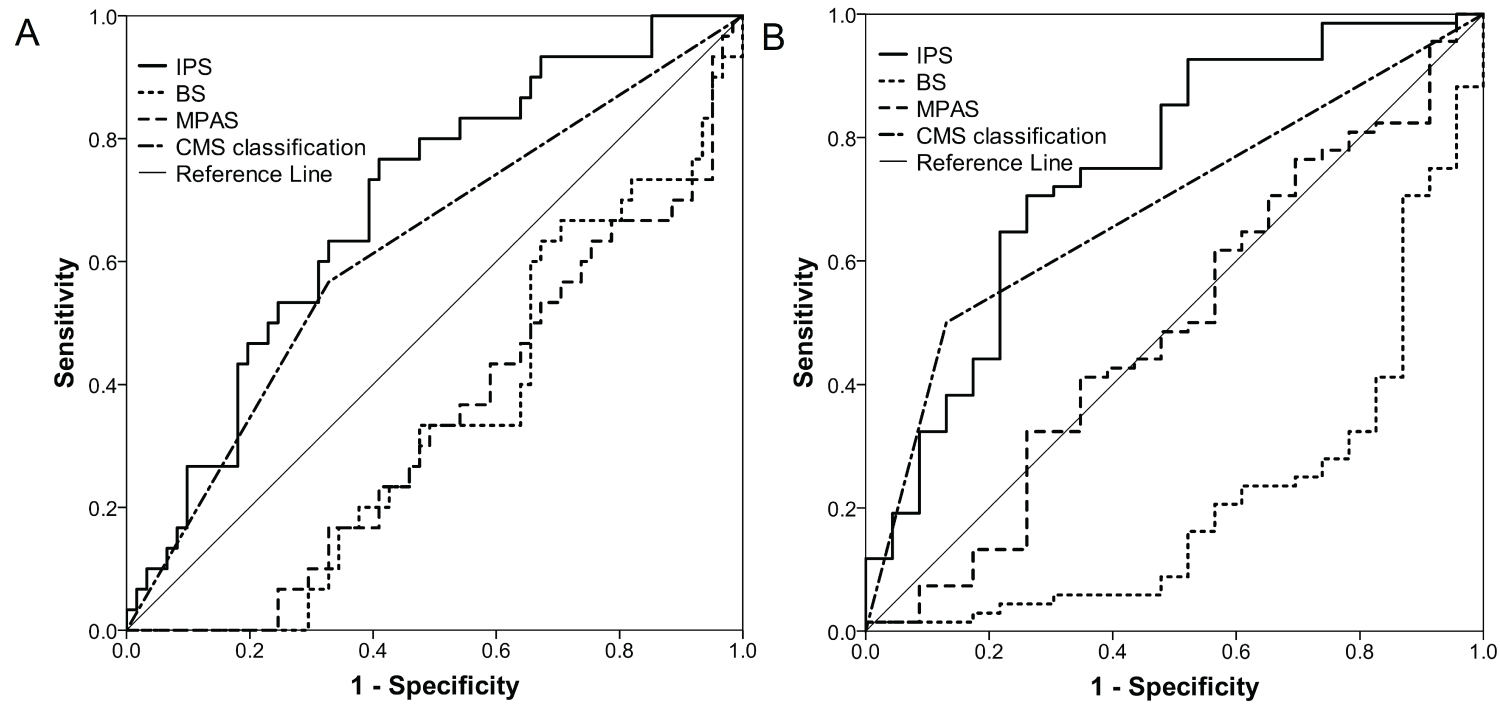 Figure 2: ROC curves showing efficiencies of IPS, BS, MPAS and CMS [CMS2 vs. CMS1/3/4] for predicting objective response (A) and disease control (B).
View Figure 2
Figure 2: ROC curves showing efficiencies of IPS, BS, MPAS and CMS [CMS2 vs. CMS1/3/4] for predicting objective response (A) and disease control (B).
View Figure 2
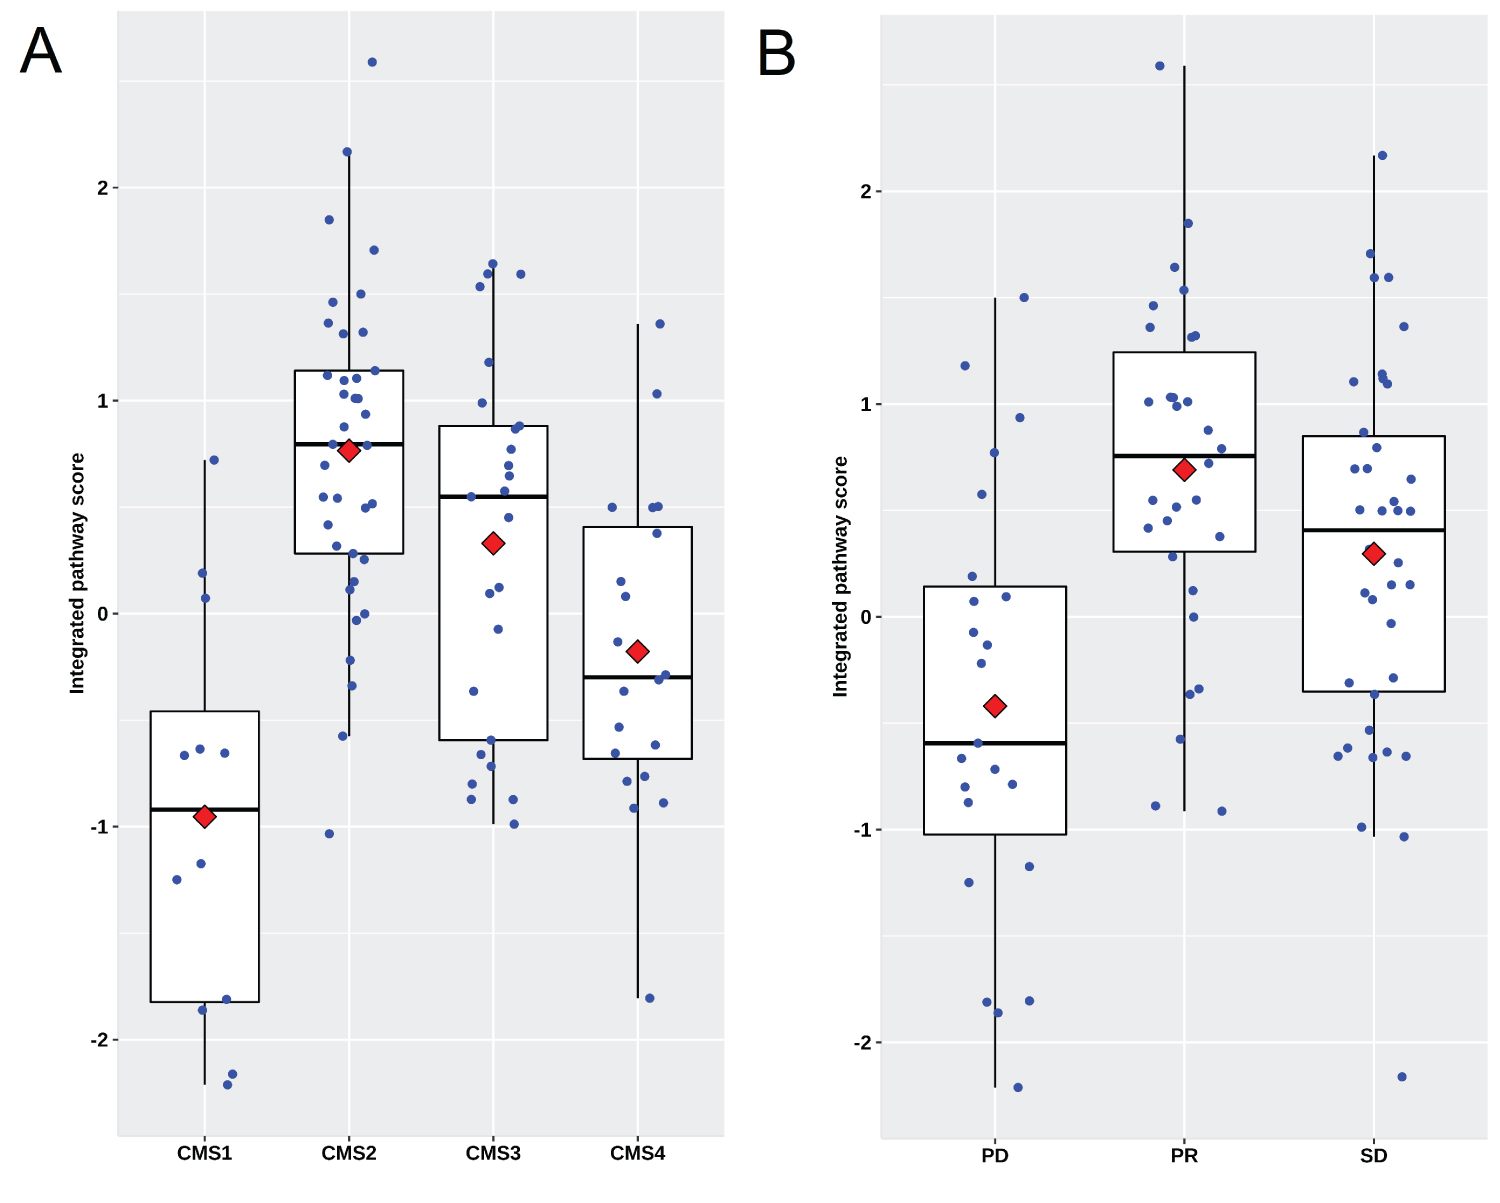 Supplementary Figure 2: Scatter plots showing the distribution of IPS in patients underwent cetuximab treatment in the second line in the validation set GSE104645. (A) IPS is significantly different among CMS subtypes; (B) IPS in the patients reached to PR and SD is significantly higher than those with PD.
View Supplementary Figure 2
Supplementary Figure 2: Scatter plots showing the distribution of IPS in patients underwent cetuximab treatment in the second line in the validation set GSE104645. (A) IPS is significantly different among CMS subtypes; (B) IPS in the patients reached to PR and SD is significantly higher than those with PD.
View Supplementary Figure 2
Table 3: Predicting sensitivity of CMS classification and IPS for disease control rate of anti-EGFR treatment in GSE104645. View Table 3
Among patients who received anti-EGFR treatment in the second-line setting, patients with a high IPS had significantly longer PFS intervals than those with a low IPS. Although an improved PFS rate was also seen in patients with a high IPS in the subgroup treated with bevacizumab in the first-line setting, patients with a high IPS who received chemotherapy alone had shorter PFS intervals than those with a low IPS (Table 4, Figure 3A, Figure 3B and Figure 3C). In contrast, although patients classified as CMS2 exhibited a longer PFS interval after treatment with anti-EGFR antibodies, the effect size between CMS2 versus CMS1/3/4 in the subgroup treated with chemotherapies alone in the first-line settings did not show the opposite trend to that observed in the anti-EGFR treatment setting (Table 4, Figure 3D, Figure 3E and Figure 3F). These results suggest that the IPS could be a predictive biomarker for anti-EGFR treatment, among metastatic colorectal cancer patients with RAS wild type and, to a lesser extent, for bevacizumab treatment.
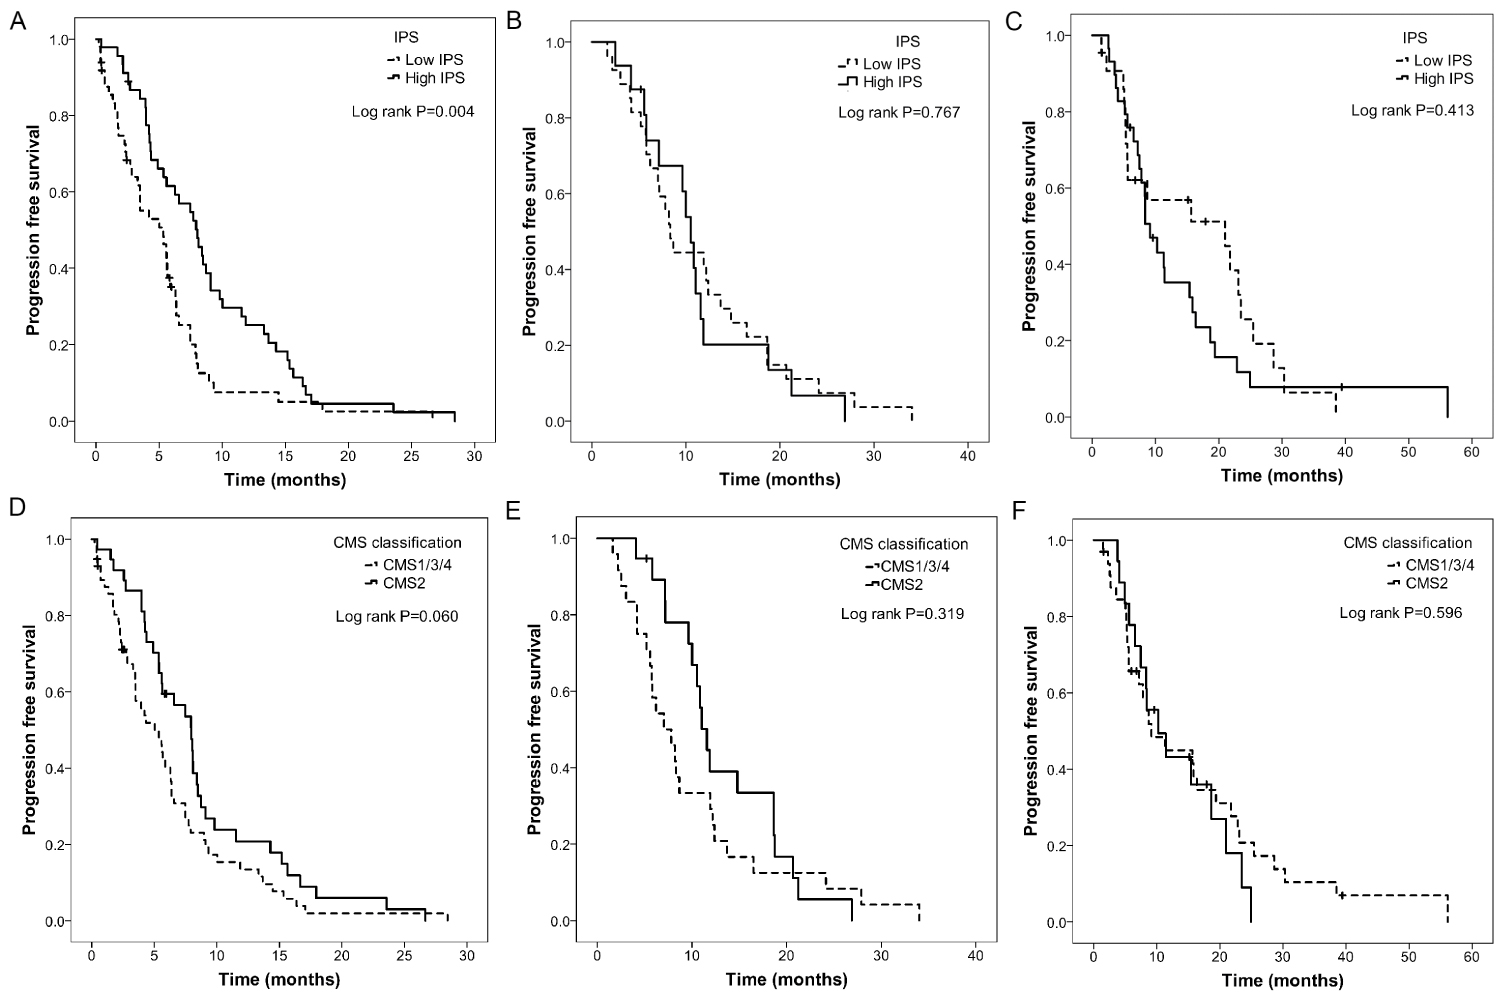 Figure 3: Prognostic value of IPS [A-C] and CMS classification [D-F] in differentclinical settings in the validation set GSE104645. (A and D) Second line with treatment of cetuximab. (B and E) First line with treatment of bevacizumab. (C and F) First line with treatment of chemotherapy alone.
View Figure 3
Figure 3: Prognostic value of IPS [A-C] and CMS classification [D-F] in differentclinical settings in the validation set GSE104645. (A and D) Second line with treatment of cetuximab. (B and E) First line with treatment of bevacizumab. (C and F) First line with treatment of chemotherapy alone.
View Figure 3
Table 4: Median PFS and 95% confidential intervals within CMS subtypes and low and high IPS subgroups in various populations received different therapeutics. View Table 4
Multivariate Cox regression analysis demonstrated that the among factors significantly associated with PFS after anti-EGFR treatment in the univariate Cox regression, only the anti-EGFR treatment pattern (combined with chemotherapies versus monotherapy), DNA methylation status and IPS were independent prognostic factors for PFS. However, only the anti-EGFR treatment pattern was an independent prognostic factor for OS (Supplementary Table 4A and Supplementary Table 4B). The time-dependent AUCs of the four gene signatures for predicting PFS and OS after anti-EGFR treatment are shown in the supplementary materials (Supplementary Figure 3A and Supplementary 3B). The C-index is shown in the supplementary materials (Supplementary Table 4C).
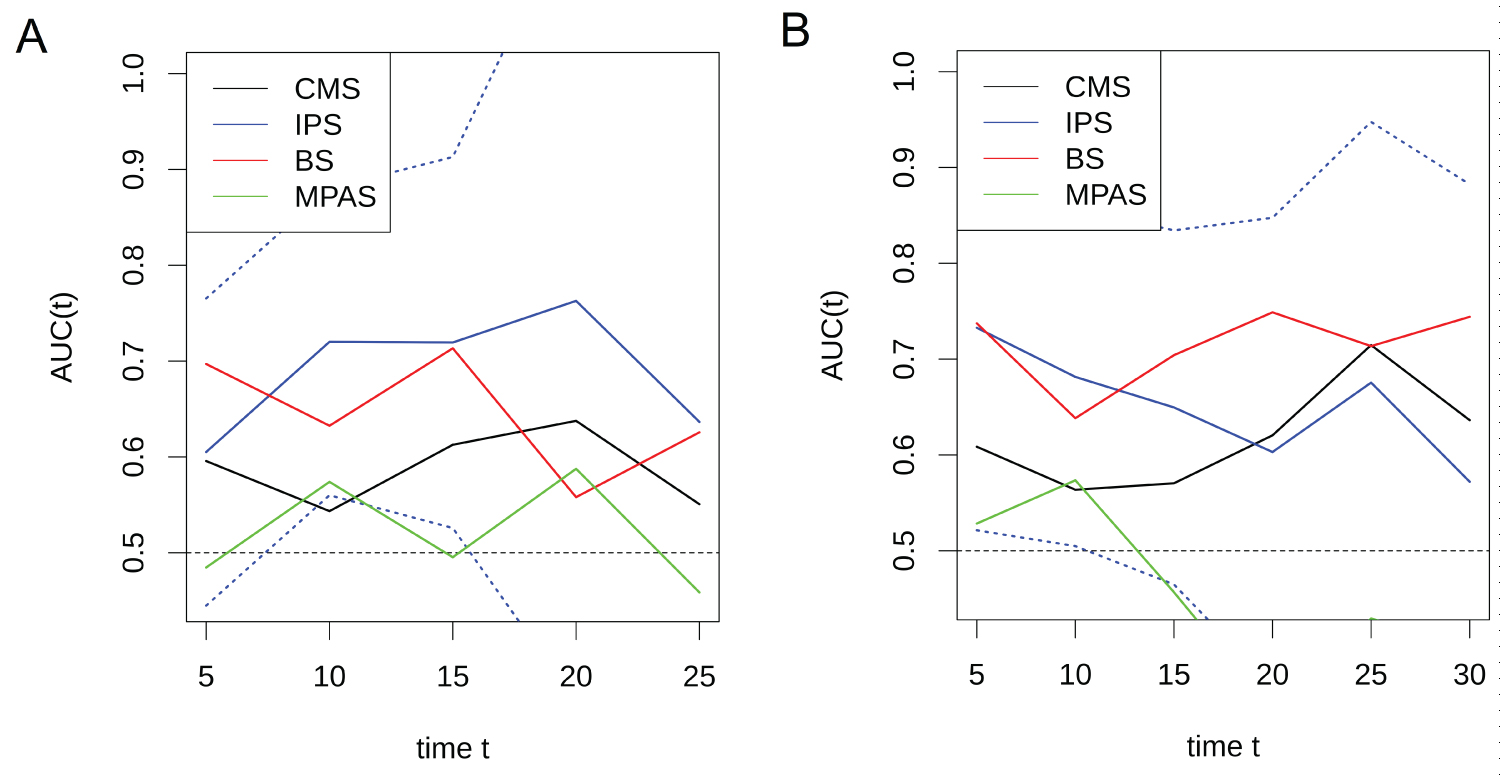 Supplementary Figure 3: The time-dependent AUCs of IPS, BS, MPAS and CMS [CMS2 vs. CMS1/3/4] for predicting PFS (A) and OS (B) after anti-EGFR treatment in the validation set GSE104645.
View Supplementary Figure 3
Supplementary Figure 3: The time-dependent AUCs of IPS, BS, MPAS and CMS [CMS2 vs. CMS1/3/4] for predicting PFS (A) and OS (B) after anti-EGFR treatment in the validation set GSE104645.
View Supplementary Figure 3
Because the validation set comprised patients who underwent first-line chemotherapies alone or in combination with bevacizumab, which could potentially alter the IPS, it was necessary to evaluate how chemotherapy changes the IPS in the tumor tissue. Among the original 124 patients in GSE41568, CMS classification was possible for 117 patients. Of these, 36 patients had available resected metastasis tissues, of whom 9 had undergone chemotherapy alone (n = 4) or in combination with bevacizumab (n = 5) before surgery. The IPS in the samples from patients treated with chemotherapy prior to surgery was numerically lower than that in samples from patients without chemotherapy; however, the difference was not statistically significant (median: -0.3457 vs. 0.3356, P = 0.315 Supplementary Figure 4A), possibly due to the extremely limited sample size. It is very likely that chemotherapy could decrease the IPS in tumor tissue. However, the IPS in these 9 patients still trended toward significance according to the stratification based on CMS classification (P = 0.067 Supplementary Figure 4B), with the highest value appearing in the CMS2 subtype, suggesting that the function of the IPS is retained despite chemotherapy treatment.
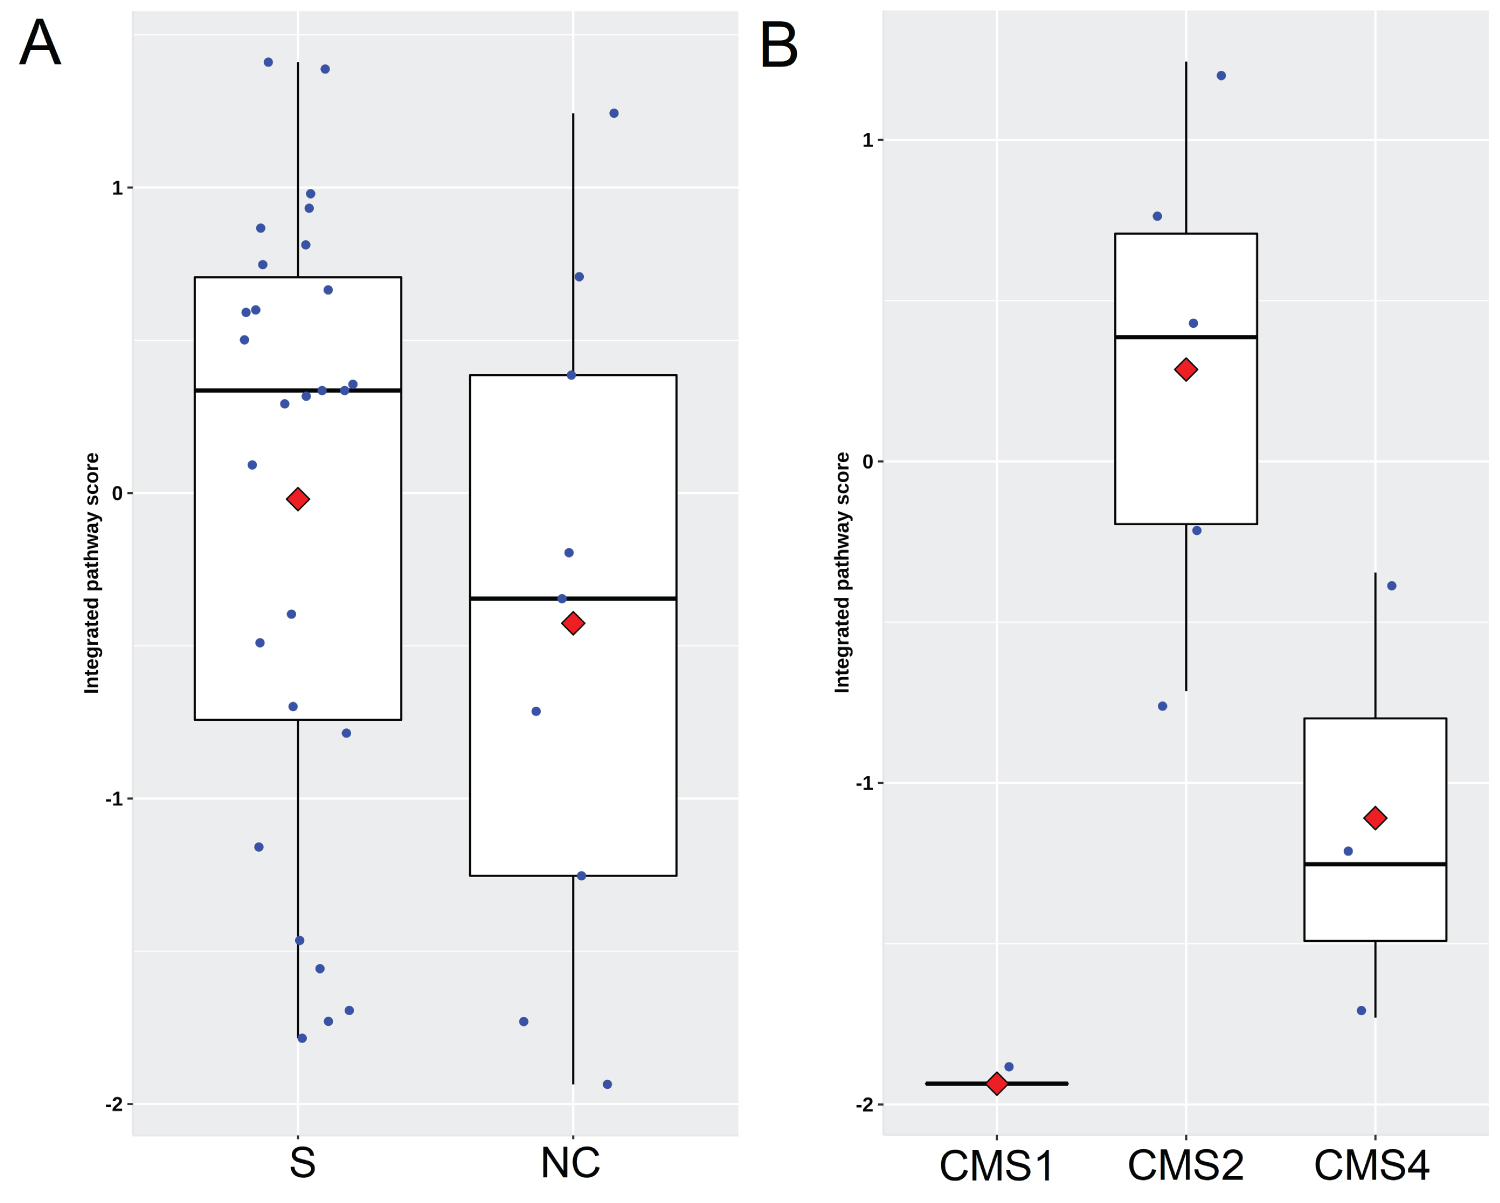 Supplementary Figure 4: Impact of chemotherapy or bevacizumab treatment on IPS. (A) Scatter plots showing IPS distribution between cases with surgery alone and cases treated with neoadjuvant chemotherapy. S and NC indicate surgery alone and neoadjuvant chemotherapy respectively; (B) IPS distribution in 9 patients with stratification based on CMS classification who had underwent chemotherapy alone [n = 4] or in combination with bevacizumab [n = 5] before resection for live metastasis.
View Supplementary Figure 4
Supplementary Figure 4: Impact of chemotherapy or bevacizumab treatment on IPS. (A) Scatter plots showing IPS distribution between cases with surgery alone and cases treated with neoadjuvant chemotherapy. S and NC indicate surgery alone and neoadjuvant chemotherapy respectively; (B) IPS distribution in 9 patients with stratification based on CMS classification who had underwent chemotherapy alone [n = 4] or in combination with bevacizumab [n = 5] before resection for live metastasis.
View Supplementary Figure 4
At present, robust verification results cannot be obtained via in silico research, mainly because all patients in the validation cohort received chemotherapy or chemotherapy plus bevacizumab prior to anti-EGFR antibody treatment. This could impair the ability of the IPS to accurately identify the benefit of anti-EGFR treatment. Furthermore, the IPS was developed in a cohort treated with cetuximab monotherapy only, which did not account for the effects stemming from cytotoxic agents. Nevertheless, the IPS was preliminarily shown to be an important predictive biomarker for anti-EGFR antibody treatment and seemed to be superior to CMS classification (Figure 3). The approach used in this study illustrates that a gene signature that is cooperatively involved in the critical biology of anti-EGFR antibodies within tumor tissues, especially the tumor microenvironment, is a feasible method to develop predictive biomarkers beyond RAS mutations.
Several gene signatures have been proposed as potential predictive biomarkers for response to anti-EGFR antibodies [2,6,12]. However, the majority of these gene signatures focused on intrinsic resistance mechanisms within epithelial tumor cells and did not take the tumor microenvironment into account. On the other hand, although CMS classification has integrated key colorectal cancer biology, including kinases, immunity, angiogenesis, etc., and has been shown to have strong predictive and prognostic value [6,11], the CMS itself was not designed for guiding biologic therapies and needs to be further refined. In this study, the IPS was at least comparable to CMS and BS with regard to predicting PFS after anti-EGFR treatment in the validation set (Supplementary Table 4C and Supplementary Figure 3A).
It is worth noting that the mechanism involved in primary resistance to anti-EGFR treatment in WT mCRC may be rather different from that of acquired resistance. Only BS and MPAS, which were relevant to cancer cell intrinsic signal transduction, were major mechanisms associated with tumor shrinkage after anti-EGFR treatment (Supplementary Table 3A). However, the IPS influenced disease progression after anti-EGFR treatment, whereas BS and MPAS did not (Supplementary Table 4A). These results suggest that the tumor microenvironment may be more important for determining the long-term benefit of anti-EGFR treatment than cancer cell intrinsic resistance mechanisms beyond RAS mutation. In fact, there is evidence of a prolonged benefit associated with an increase in Th1 and CD8+ T cell infiltration in patients who undergo single-agent cetuximab treatment [17].
In conclusion, we developed this computational IPS framework to achieve better therapeutic benefits with current CRC treatment strategies. The present study revealed some important clinical implications of the IPS. First, the IPS-high subgroup might have longer PFS intervals in with anti-EGFR antibody treatment, such as cetuximab. Second, the tumor microenvironment has a more important role than cancerous cells with regard to the long term survival benefit. Third, chemotherapy alone or combined with bevacizumab might lead to a decreased IPS score, which could impair the tumor microenvironment and render the cells favorable to anti-EGFR antibody treatment in RAS WT mCRC (Supplementary Figure 4A). Thus, we prudently hypothesize that it might be better to use cetuximab as a first-line treatment in RAS WT mCRC for comprehensive therapeutics. A meta-analysis demonstrated a potentially greater OS, ORR and ETS benefit of first-line EGFR antibodies plus chemotherapy versus bevacizumab plus chemotherapy for RAS WT mCRC [18]. This finding may also provide a possible explanation forthe results of the PRODIGE18 study [19]. In this randomized clinical trial, it was observed that continuing bevacizumab with chemotherapy for patients with RAS WT mCRC beyond progression is superior to switching to cetuximab with chemotherapy. These conjectures need to be further validated to be more clinically pragmatic as sufficiently large datasets accumulate. It is promising that the IPS could be used in combination with other biomarkers to achieve more robust prediction performance in mCRC treatment. Furthermore, future studies are warranted to determine the value of the IPS presented here in other cancer types, such as head and neck cancer.