Cancer burden is a globally growing problem. Early diagnosis and targeted treatment decrease patients' death rate, pain, and treatment expenses. Liquid biopsy can be used for early cancer detection, treatment selection, and progression and treatment response monitoring. We evaluated the performance of circulating cell-free DNA (cfDNA) and formalin-fixed paraffin-embedded (FFPE) tissue DNA analyses using a commonly employed targeted therapeutic pathway in predicting the outcomes of patients with lung cancer, a common cancer with a generally poor prognosis.
Patients with advanced lung cancer (n = 106) and predominantly adenocarcinoma histology donated blood samples at baseline and progression (n = 22), with matched archival FFPE biopsy samples being available for 75 patients. We set up a targeted 21-amplicon sequencing workflow for the analysis of mutations in nine genes (ALK, AKT1, BRAF, EGFR, ERBB2, KRAS, MET, NRAS, and PIK3CA). Molecular characteristics such as cfDNA concentration, number of mutations, and mutation occurrence in specific genes, were analyzed in respect of clinical outcome. To identify factors associated with overall survival (OS), a multivariate analysis was performed, using the technique of Cox regression.
The median age of the study population was 67 years with 53.8% male patients. The patients had primarily adenocarcinoma (79.2%) and stage IV disease (83%). The median OS was 327 (95% CI 275–514) days. Higher cfDNA concentrations were associated with poorer OS (HR = 1.670, 95% CI 1.108–2.516, P = 0.014). Detectable mutations [variant allele frequency (VAF) > 0.8%] were found in 63 (59%) patients' baseline samples (median VAF = 1.1%). OS was significantly improved among patients with at least one mutation detected in cfDNA than among those with no mutation (HR = 0.477, 95% CI 0.313–0.727, P = 0.0006). In baseline cfDNA, patients with mutations of VAFs < 5% had significantly better OS compared to patients with mutations of VAFs ≥ 5% (HR = 3.510, 95% CI 1.672–7.370, P = 0.0009). Patients with slowly progressing disease had significantly more cfDNA mutations than did those with rapid cancer progression (P = 0.045). EGFR alterations explained half (16/33) of slowly progressing cases (median OS 953 days). All associations in FFPE biopsy material were statistically insignificant.
The cfDNA concentration and somatic mutation profile have a clinically relevant prognostic impact in advanced lung cancer management. Our key finding was that cfDNA analysis performs better than FFPE tissue analysis in the prediction of patients' OS and disease progression.
Cell-free DNA, Liquid biopsy, Advanced lung cancer, Tumor NGS, Overall survival, Cancer progression, Cancer prognosis, Real-world data
AIH: Amplicon Indel Hunter; cfDNA T1: cell-free DNA collected at enrollment; cfDNA T2: cell-free DNA collected after cancer progression; CI: Confidence Interval; FFPE DNA: Formalin-Fixed Paraffin-Embedded tissue DNA; HR: Hazard Ratio; Indel: Insertion and Deletion; NGS: Next-Generation Sequencing; NSCLC: Non-Small Cell Lung Cancer; OS: Overall Survival; OS2: Overall Survival after cancer progression; TKI: Tyrosine Kinase Inhibitor; VAF: Variant Allele Frequency, a fraction of cfDNA that harbors a specific alteration
The usefulness of the analysis of circulating cell-free DNA (cfDNA) from blood ("liquid biopsy") for cancer diagnosis, monitoring, and treatment selection has been firmly established [1-4]. Liquid biopsy is an attractive alternative to more-invasive interventional solid-tissue biopsy for the guidance of therapeutic management based on somatic cancer variants [5]. cfDNA levels or variant allele frequencies (VAFs; fractions of cfDNA harboring a specific alteration) can be monitored longitudinally as potential prognostic biomarkers [6,7]. cfDNA mutation profiling by next-generation sequencing (NGS) has very high sensitivity [8,9]. For example, the incorporation of white blood cells to filter out somatic mutations associated with clonal hematopoiesis can enable the detection of mutations with VAFs below < 1% [10]. In addition, plasma cfDNA sequencing reduces the possibility that clinically relevant mutations in late-stage cancers are missed due to the issue of heterogeneity for biopsies obtained from single metastatic sites [11,12]. cfDNA analysis has been used successfully to identify actionable mutations in the epidermal growth factor receptor (EGFR) gene and other genes for the targeted treatment of non-small cell lung cancer (NSCLC) [13-15]. Despite these potential advantages, however, the analysis of DNA from formalin-fixed paraffin-embedded solid-tumor tissue samples (FFPE DNA) remains much more common in the clinical setting.
Several challenges associated with the use of cfDNA analysis, such as the accurate quantification and interpretation of VAFs, and the interpretation of variants with consideration of the complexity of the tumor mutational landscape remain [16,17]. Along with the lack of technical standardization, these challenges have led to some skepticism concerning the implementation of cfDNA analysis in daily clinical practice [17,18]. Emerging guidelines and standardized recommendations for cfDNA analysis and liquid biopsy in general are crucial for the development of this field [3,5,19,20].
This study was performed to evaluate the prognostic value of targeted cfDNA analysis relative to that of FFPE DNA analysis for advanced lung cancer. We hypothesized that differences in patients' cancer progression and overall survival (OS) would be reflected in mutation profiles determined by both methods. We set up an NGS workflow to analyze cancer-related mutations in the nine frequently mutated genes in the EGFR pathway. Genetic findings from cfDNA and FFPE DNA analyses, as well as cfDNA concentrations, were compared with patients' clinical profiles and therapeutic outcomes.
In total, 106 patients with lung cancer treated between November 2014 and December 2016 at the North Estonia Medical Centre, Tallinn, Estonia, and Tartu University Hospital, Tartu, Estonia, were enrolled in this study. The main criteria for selection were adult status and the presence of treatment- naïve metastatic or locally advanced lung cancer with predominant adenocarcinoma histology. The Research Ethics Committee of the University of Tartu approved this study (no. 232/M-15, 03.01.2014) and all patients provided written informed consent.
Baseline blood samples (n = 106) were collected into 10-mL cell-free DNA BCT® tubes (Streck, Inc., La Vista, NE, USA) at enrollment (T1), when possible before the initiation of systemic treatment. Second blood samples (n = 22) were taken at progression (T2). Matched FFPE tumor tissue samples were collected during routine clinical diagnostic procedures and submitted to mutation analysis when sufficient tumor tissue was available (n = 75). Upon arrival at the Estonian Genome Centre for DNA isolation and sequencing, all samples were pseudonymized for further use.
Data on patients' baseline clinical characteristics were collected from institutional electronic medical records. The duration of systemic anticancer treatment was calculated from the first day of the first treatment cycle to the first day of the last cycle, except in cases of EGFR tyrosine kinase inhibitor (TKI) therapy, for which the date of last theoretical administration based on the number of tablets prescribed was used. Patients' OS (data cutoff 30 of April 2020) was calculated from the date of biopsy or recurrence. A second measure of overall survival (OS2) was calculated from the date of second blood sample collection at the time of progression to death or data cutoff. Based on the duration of systemic anticancer treatment and OS, the patients were divided retrospectively into two cohorts: slow and rapid progression.
Two-step centrifugation of the blood samples was used to remove as much contaminating cellular content as possible before cfDNA extraction: patients' blood samples were centrifuged at 1600 × g for 15 min, the supernatant and 1 mL buffy coat were isolated, and the supernatant was centrifuged at 2500 × g for 10 min. The plasma and buffy coat samples were stored at –80 ℃ in 2-mL and 1-mL aliquots, respectively.
cfDNA was extracted from the 2-mL plasma samples using a modified protocol and the QIAamp circulating nucleic acid kit (Qiagen N.V., Hilden, Germany; Supplementary Methods S1). Buffy coat DNA was extracted from 200-µL whole blood samples using the GeneJET whole blood genomic DNA purification mini kit (Thermo Fisher Scientific Inc., Waltham, MA, USA). FFPE DNA was isolated using the GeneRead™ DNA FFPE kit (Qiagen N.V.) with eluting the samples twice to increase the DNA yield. All samples were stored at –80 ℃. Isolated cfDNA was quantified using Qubit double-stranded DNA (dsDNA) High Sensitivity kit; buffy coat DNA and FFPE DNA were quantified using Qubit dsDNA Broad Range kit (both Thermo Fisher Scientific Inc.). For quality control, the lengths of the cfDNA and FFPE DNA fragments were measured using the TapeStation 2200 system with High Sensitivity D1000 ScreenTape® and D1000 ScreenTape®, respectively. The results were visualized with TapeStation Analysis software (Agilent Technologies, Inc., Santa Clara, CA, USA).
Based on the literature and the Catalogue of Somatic Mutations in Cancer database [21], nine genes that are frequently mutated in lung adenocarcinoma and NSCLC (ALK, AKT1, BRAF, EGFR, ERBB2, KRAS, MET, NRAS, and PIK3CA) were selected. For these genes, primers for 21 amplicons in total were designed and Illumina® overhanging adapters (Illumina, Inc., San Diego, CA, USA) were added to the 5' ends. The primers were divided into three multiplex groups to minimize the number of PCR reactions. The selected amplicons, with their coordinates, primers, and multiplex groups, are listed in Supplementary Methods S2.
For library preparation, two-step amplification was used: multiplex amplicon PCR was performed, followed by index PCR. The reaction mixture for amplicon PCR consisted of 1× HOT FIREPol® GC Master Mix (Solis BioDyne OÜ, Tartu, Estonia), 1 mM MgCl2 (Solis BioDyne OÜ), 49 pmol forward and reverse primer mix (for seven amplicons) and about 3 ng cfDNA or 8 ng FFPE or buffy coat DNA in a total volume of 25 µL. Amplifications were carried out in an Arktik™ thermal cycler (Thermo Fisher Scientific Inc.; Supplementary Methods S3). After PCR, all products were cleaned with Agencourt AMPure XP magnetic beads (Beckman Coulter Inc., Brea, CA, USA) and quantified with Qubit (Thermo Fisher Scientific Inc.) and TapeStation (Agilent Technologies, Inc.). Products from three different multiplex groups were mixed together in equimolar concentrations.
For index PCR, a modified Illumina 16S metagenomic sequencing library preparation protocol was used (Supplementary Methods S4). The PCR products were cleaned with Agencourt AMPure XP magnetic beads (Beckman Coulter Inc.) and quantified with Qubit (Thermo Fisher Scientific Inc.) and TapeStation (Agilent Technologies, Inc.). All samples were diluted to 10 ng/µL and pooled for sequencing. The libraries were validated by quantitative PCR with KAPA library quantification kit (Kapa Biosystems, Inc., Woburn, MA, USA) to optimize cluster generation.
Targeted panel sequencing was performed on plasma cfDNA collected at T1 and T2, buffy coat DNA, and, for a subset of patients, matched FFPE DNA. NGS was carried out with the MiSeq desktop sequencer (Illumina, Inc.) using MiSeq reagent kit v2 chemistry (Illumina, Inc.) with 2 × 116-bp paired-end reads. Adaptor sequences and low-quality read ends (phased score < 20) were trimmed using TrimGalore (version 0.4.2) [22], such that both reads of each pair were longer than 40 bp. The trimmed reads were aligned to the human reference genome GRCh37 using BWA-MEM (version 0.7.7) [23]. Insertion and deletion (indel) realignment and base recalibration were performed using GATK (version 4.1.5.0) [24].
Somatic single nucleotide variants and small indels were called by using Mutect2 [24,25] in the matched normal mode. Raw calls were reviewed by Mutect2 FilterMutectCalls function; "normal_artifact" and "weak_evidence" calls were excluded. Somatic mutations were also identified by VarScan (version 2.4) [26] using the following parameters: --min-avg-qual 20, --min-reads2 20, --min-coverage 100, --normal-purity 1.0, --tumor-purity 0.3, --min-var-freq 0.008, --p-value 0.1, and --strand-filter 0. Raw somatic calls were filtered using fp filter from VarScan with the following parameters: --min-var-count 20, --min-var-freq 0.008, --min-ref-basequal 20, and --min-var-basequal 20. For the analyses performed with Mutect2 and VarScan, we used buffy coat DNA as the matched normal sample to filter out germline variants. Raw paired-end FASTQ files were used as inputs in Amplicon Indel Hunter (AIH; version 1.1.0) [27] to detect large (> 5 bp) somatic indels (--cushion 3, --maf 0.008). All three call sets were merged, including variants with minimum VAFs (> 0.8%) in cfDNA and FFPE samples, cfDNA or FFPE DNA/buffy coat DNA VAF ratios > 3, and read depths > 1000. For variants detected by multiple approaches, the maximum of all available tumor VAFs was taken. All detected alterations were curated further by manual inspection using the Integrative Genomics Viewer [28] and annotated using VarMap [29].
We used the interquartile range [IQR = upper quantile (Q3) – lower quantile (Q1)] criterion to inspect cfDNA concentration values. Observations falling outside of the range Q1 – 4 * IQR or Q3 + 4 * IQR were considered to be outliers. Associations between the cfDNA concentration and number of detected mutations were assessed using Spearman's correlation.
The Kaplan–Meier method was used to estimate OS, and the log-rank test was used to compare OS among patient groups. Univariate Cox regression analysis was used to evaluate baseline covariates (age, sex, disease stage, and smoking). Potential prognostic factors (cfDNA concentration and number of detected mutations) in advanced lung cancer were assessed by multivariable Cox regression models, adjusted for sex. For the analyses, patients were dichotomized into two groups based on the median cfDNA concentrations (< 0.60 vs. ≥ 0.60 ng/μL at T1, < 0.75 vs. > 0.75 ng/μL at T2) and by the number of detected mutations (0 vs. ≥ 1). Gene-specific analyses were performed for ALK, EGFR, and KRAS, in which ≥ 10 patients had at least one mutation. Secondary analyses among VAF groups (no mutation, VAF < 5%, VAF ≥ 5%) and mutation types (no mutation, missense, other type) were conducted. All Cox models were estimated under the proportional hazards assumption and the results are presented as hazard ratios (HRs) with 95% confidence intervals (CIs).
Pearson's chi-squared test was used to compare detected somatic mutations in slow and rapid progression cohorts. All tests were two sided, and P values < 0.05 were considered to be significant. All statistical analyses were performed with R (version 3.6.3) [30].
We set up a retrospective patient follow-up study with an amplicon-based NGS workflow to compare the performance of cfDNA and FFPE DNA analyses. We analyzed plasma samples from a real-world clinical cohort of 106 lung cancer patients; matched FFPE tumor tissue samples were available for 75 of these patients and repeated cfDNA samples were collected from 22 patients. The study flow is illustrated in Figure 1.
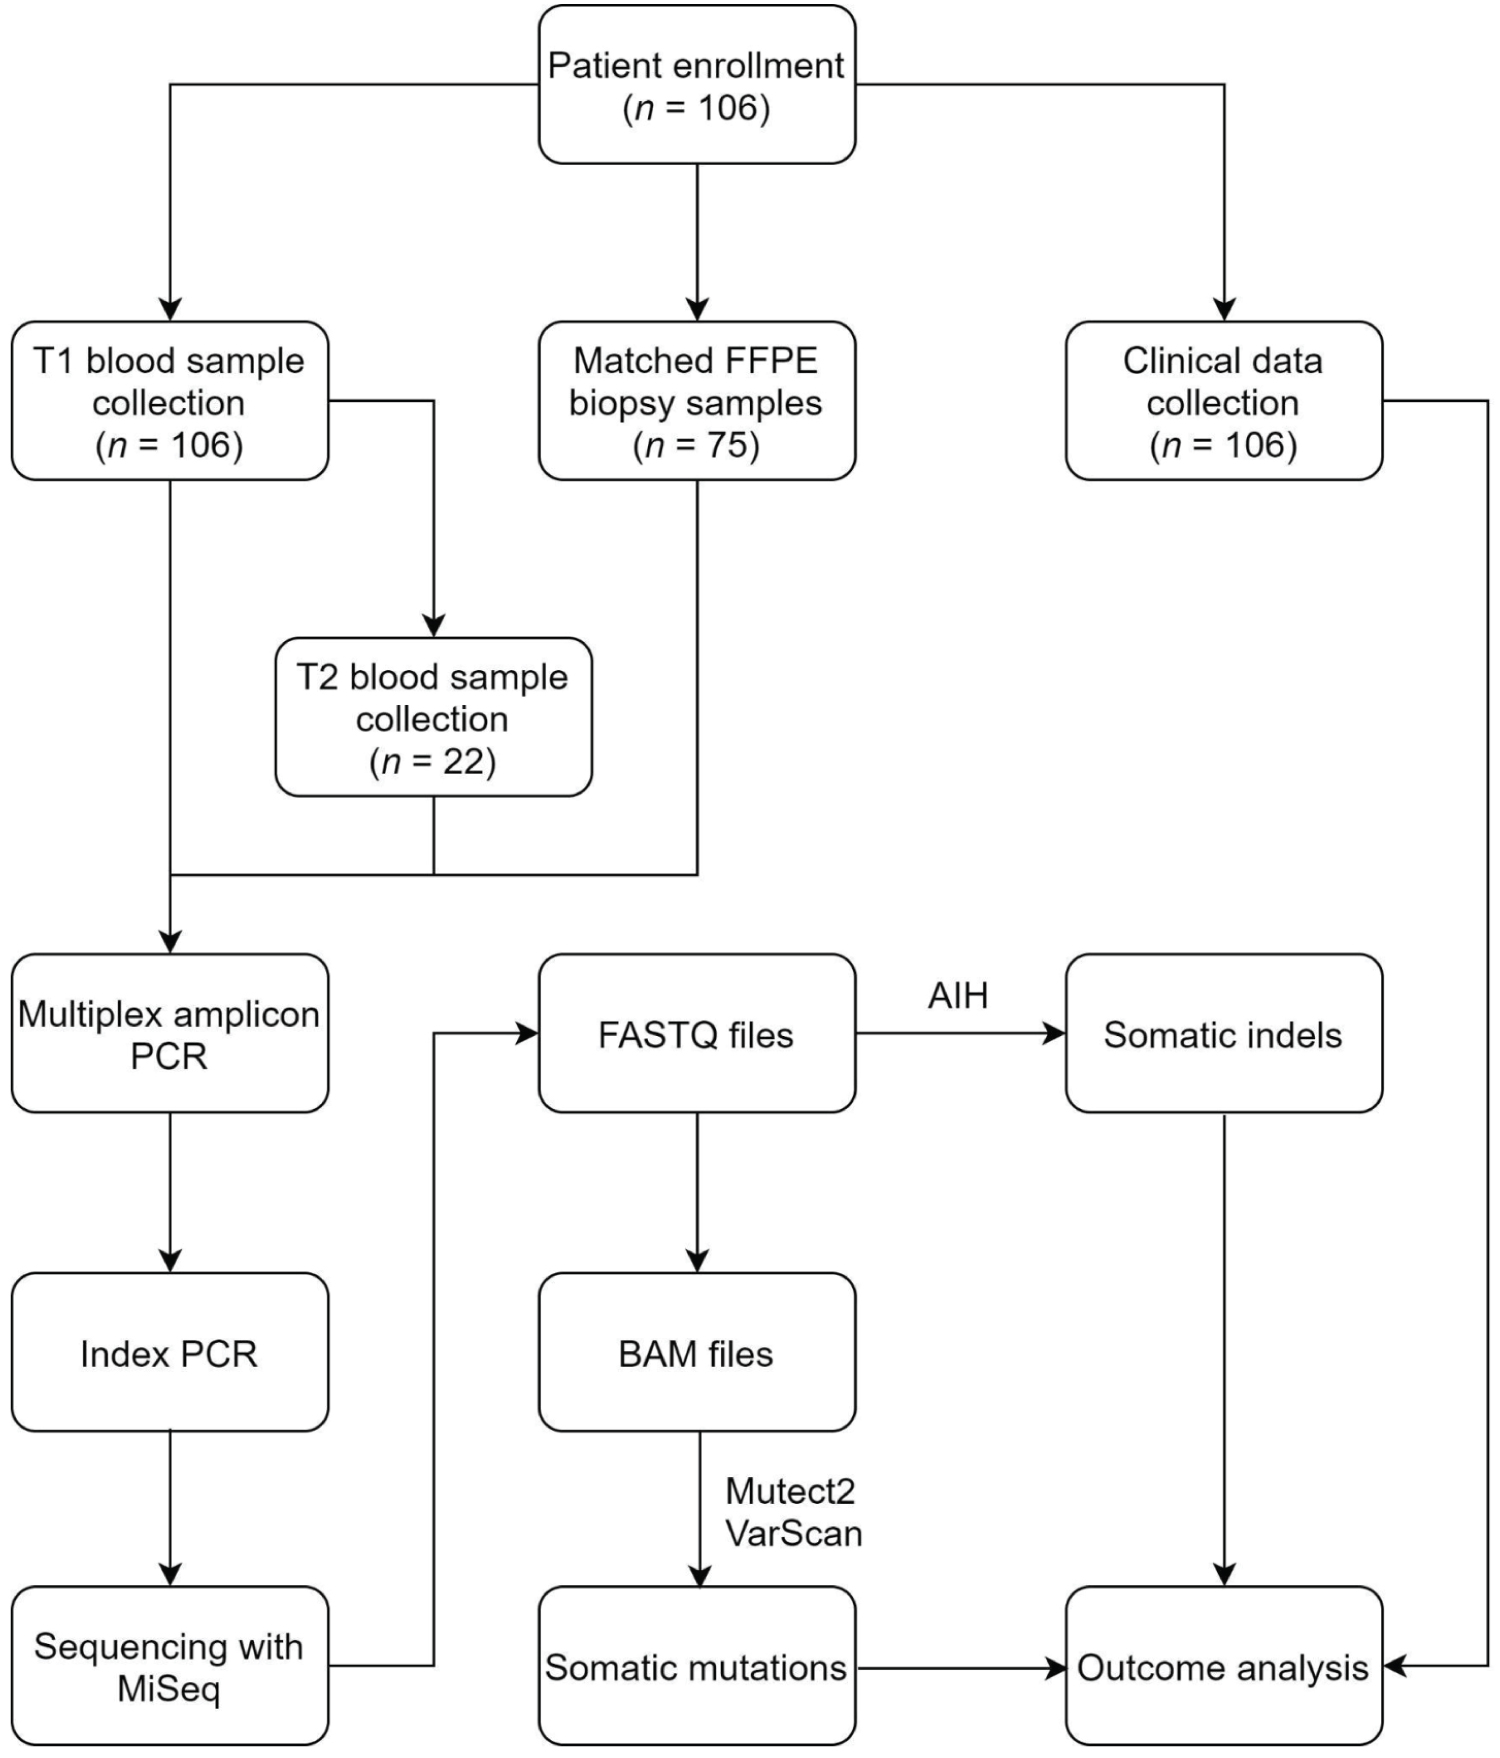 Figure 1: Diagram of the study flow.
T1: at enrollment; FFPE: Formalin-Fixed Paraffin-Embedded; T2: after cancer progression; AIH: Amplicon Indel Hunter
View Figure 1
The characteristics of the 106 enrolled patients with advanced lung cancer are summarized in Table 1. All patients were of European descent, and the median age was 67 years. The cohort of patients consisted of 53.8% of men, had primarily stage IV disease (83%) and adenocarcinoma histology (79.2%). At the time of enrollment, all patients had adenocarcinoma initial cytology; final reports for 22 patients indicated no histology (n = 2), NSCLC (n = 11), or other histology (n = 9). Eighteen (17%) patients had sensitizing mutations in the EGFR gene, as determined by the hospitals' diagnostic laboratories. Nine patients had baseline blood samples taken at the time of progression while receiving systemic anticancer treatment.
Table 1: Baseline clinical characteristics of the study cohort. View Table 1
The median sequencing depths at variant positions for the plasma, buffy coat, and FFPE samples were 12352×, 8907×, and 7044×, respectively. The consistency of VAF estimates for mutations detected in cfDNA at T1 and in FFPE DNA is shown in Supplementary Results F1. VAF estimates called with the Mutect2 and VarScan algorithms showed a high degree of agreement (Supplementary Results F2). VarScan identified about three times more mutations than did Mutect2, and the majority of VarScan-specific mutations had lower allelic frequencies than did those identified with Mutect2 and AIH (Supplementary Results F3). An overview of the somatic mutations detected is provided in Supplementary Results T1. The majority of mutations had VAFs > 5% (89/111 from cfDNA obtained at T1 and 117/157 from FFPE DNA) and were missense mutations (70/111 from cfDNA obtained at T1 and 90/157 from FFPE DNA).
In cfDNA (T1 and T2) and FFPE DNA samples combined, we detected 111 (61 unique within sample type), 10 (8 unique), and 157 (105 unique) mutations of the nine sequenced genes with VAFs > 0.8%, respectively. In total, we found 143 unique mutations, of which 39 (27%) were novel (Supplementary Results T2). EGFR harbored the most somatic mutations, followed by ALK and KRAS (Figure 2). Mutations p.N764S in ERBB2 and p.E545K in PIK3CA were found only in cfDNA samples obtained at T2.
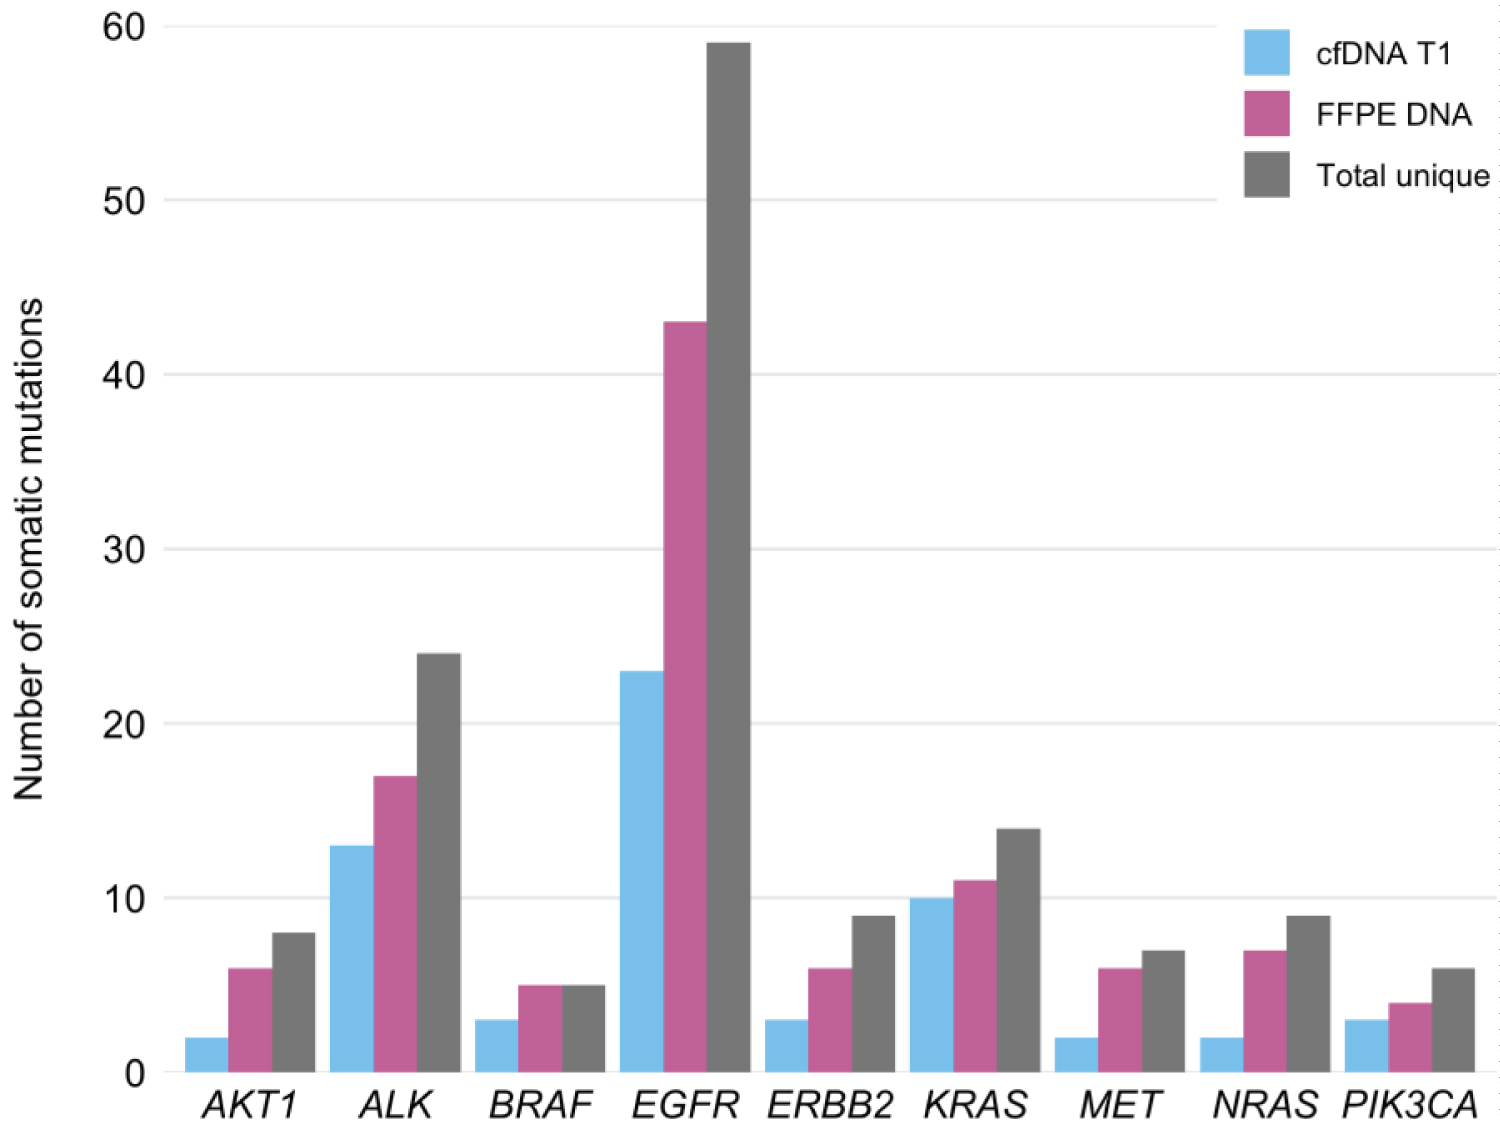 Figure 2: Numbers of somatic mutations detected.
cfDNA: cell-free DNA; T1: at enrollment; FFPE: Formalin-Fixed Paraffin-Embedded; Total unique: cfDNA T1 and FFPE DNA mutations combined
View Figure 2
Targeted NGS revealed that 63 (59%) of the 106 cfDNA T1 samples had detectable mutations in the selected regions [median = 1 (range 0–7) alterations], with a median VAF of 1.1% (range 0.8–79.4%). Sixty (80%) of the 75 FFPE DNA samples analyzed had mutations [median = 1 (range 0–13) alterations], with a median VAF of 1.2% (range 0.8–91.6%). The number of mutations detected per patient by sample type is shown in Supplementary Results T3.
In the matched T1 cfDNA and FFPE DNA samples from 75 patients, we identified 80 mutations in cfDNA obtained at T1, and 157 mutations in FFPE DNA, (27 (12.9%) mutations overlapped). We observed approximately 1.5 times more C > T and G > A substitutions in the FFPE DNA samples than in the cfDNA samples (Supplementary Results F4).
EGFR TKI–sensitive EGFR mutations were detected in samples from 23 (21.7%) patients. Matched FFPE DNA samples were available from 19 of the 23 patients. In addition to mutations detected by the hospitals' diagnostic laboratories, we found one p.T790M EGFR TKI resistance mutation in cfDNA obtained at T1 (VAF = 14.7%) and one p.L861Q EGFR TKI–sensitive mutation in FFPE DNA (VAF = 25.6%; Supplementary Results T4).
The median cfDNA concentrations at T1 and T2 were 0.609 (range 0.126–3.620) ng/μL and 0.760 (range 0.212–6.620) ng/μL, respectively. Patients with higher cfDNA concentrations tended to have fewer detected mutations, but this association was not significant at T1 or T2 (T1: Spearman's r = –0.19, P = 0.054 and T2: Spearman's r = –0.03, P = 0.888).
The median OS was 327 (95% CI 275–514) days. One-, three-, and five-year survival estimates were 47.2% (95% CI 38.6–57.7%), 17.0% (95% CI 11.1–25.9%), and 7.7% (95% CI 3.8–15.4%), respectively. During the follow-up period, 97 (91.5%) patients died.
Estimates of overall survival for the detected mutations (0 vs. ≥ 1) are given in Figure 3. The two groups differed significantly in the cases of mutations in ALK (only in cfDNA; P = 0.002, Figure 3A) and in EGFR (both in cfDNA and FFPE DNA; P = 0.027, P = 0.043; Figures 3C and Figure 3D, respectively), with the presence of mutations correlating positively with survival. The presence of mutations in KRAS in cfDNA tended to be associated with worse survival, although not significantly (P = 0.057, Figure 3E), and therefore KRAS was excluded from the pooled analysis. The detection of at least one mutation in cfDNA T1 was associated with significantly better survival (P = 0.0003, Figure 3G); no significant survival difference was observed for mutations detected in FFPE DNA (P = 0.230, Figure 3H).
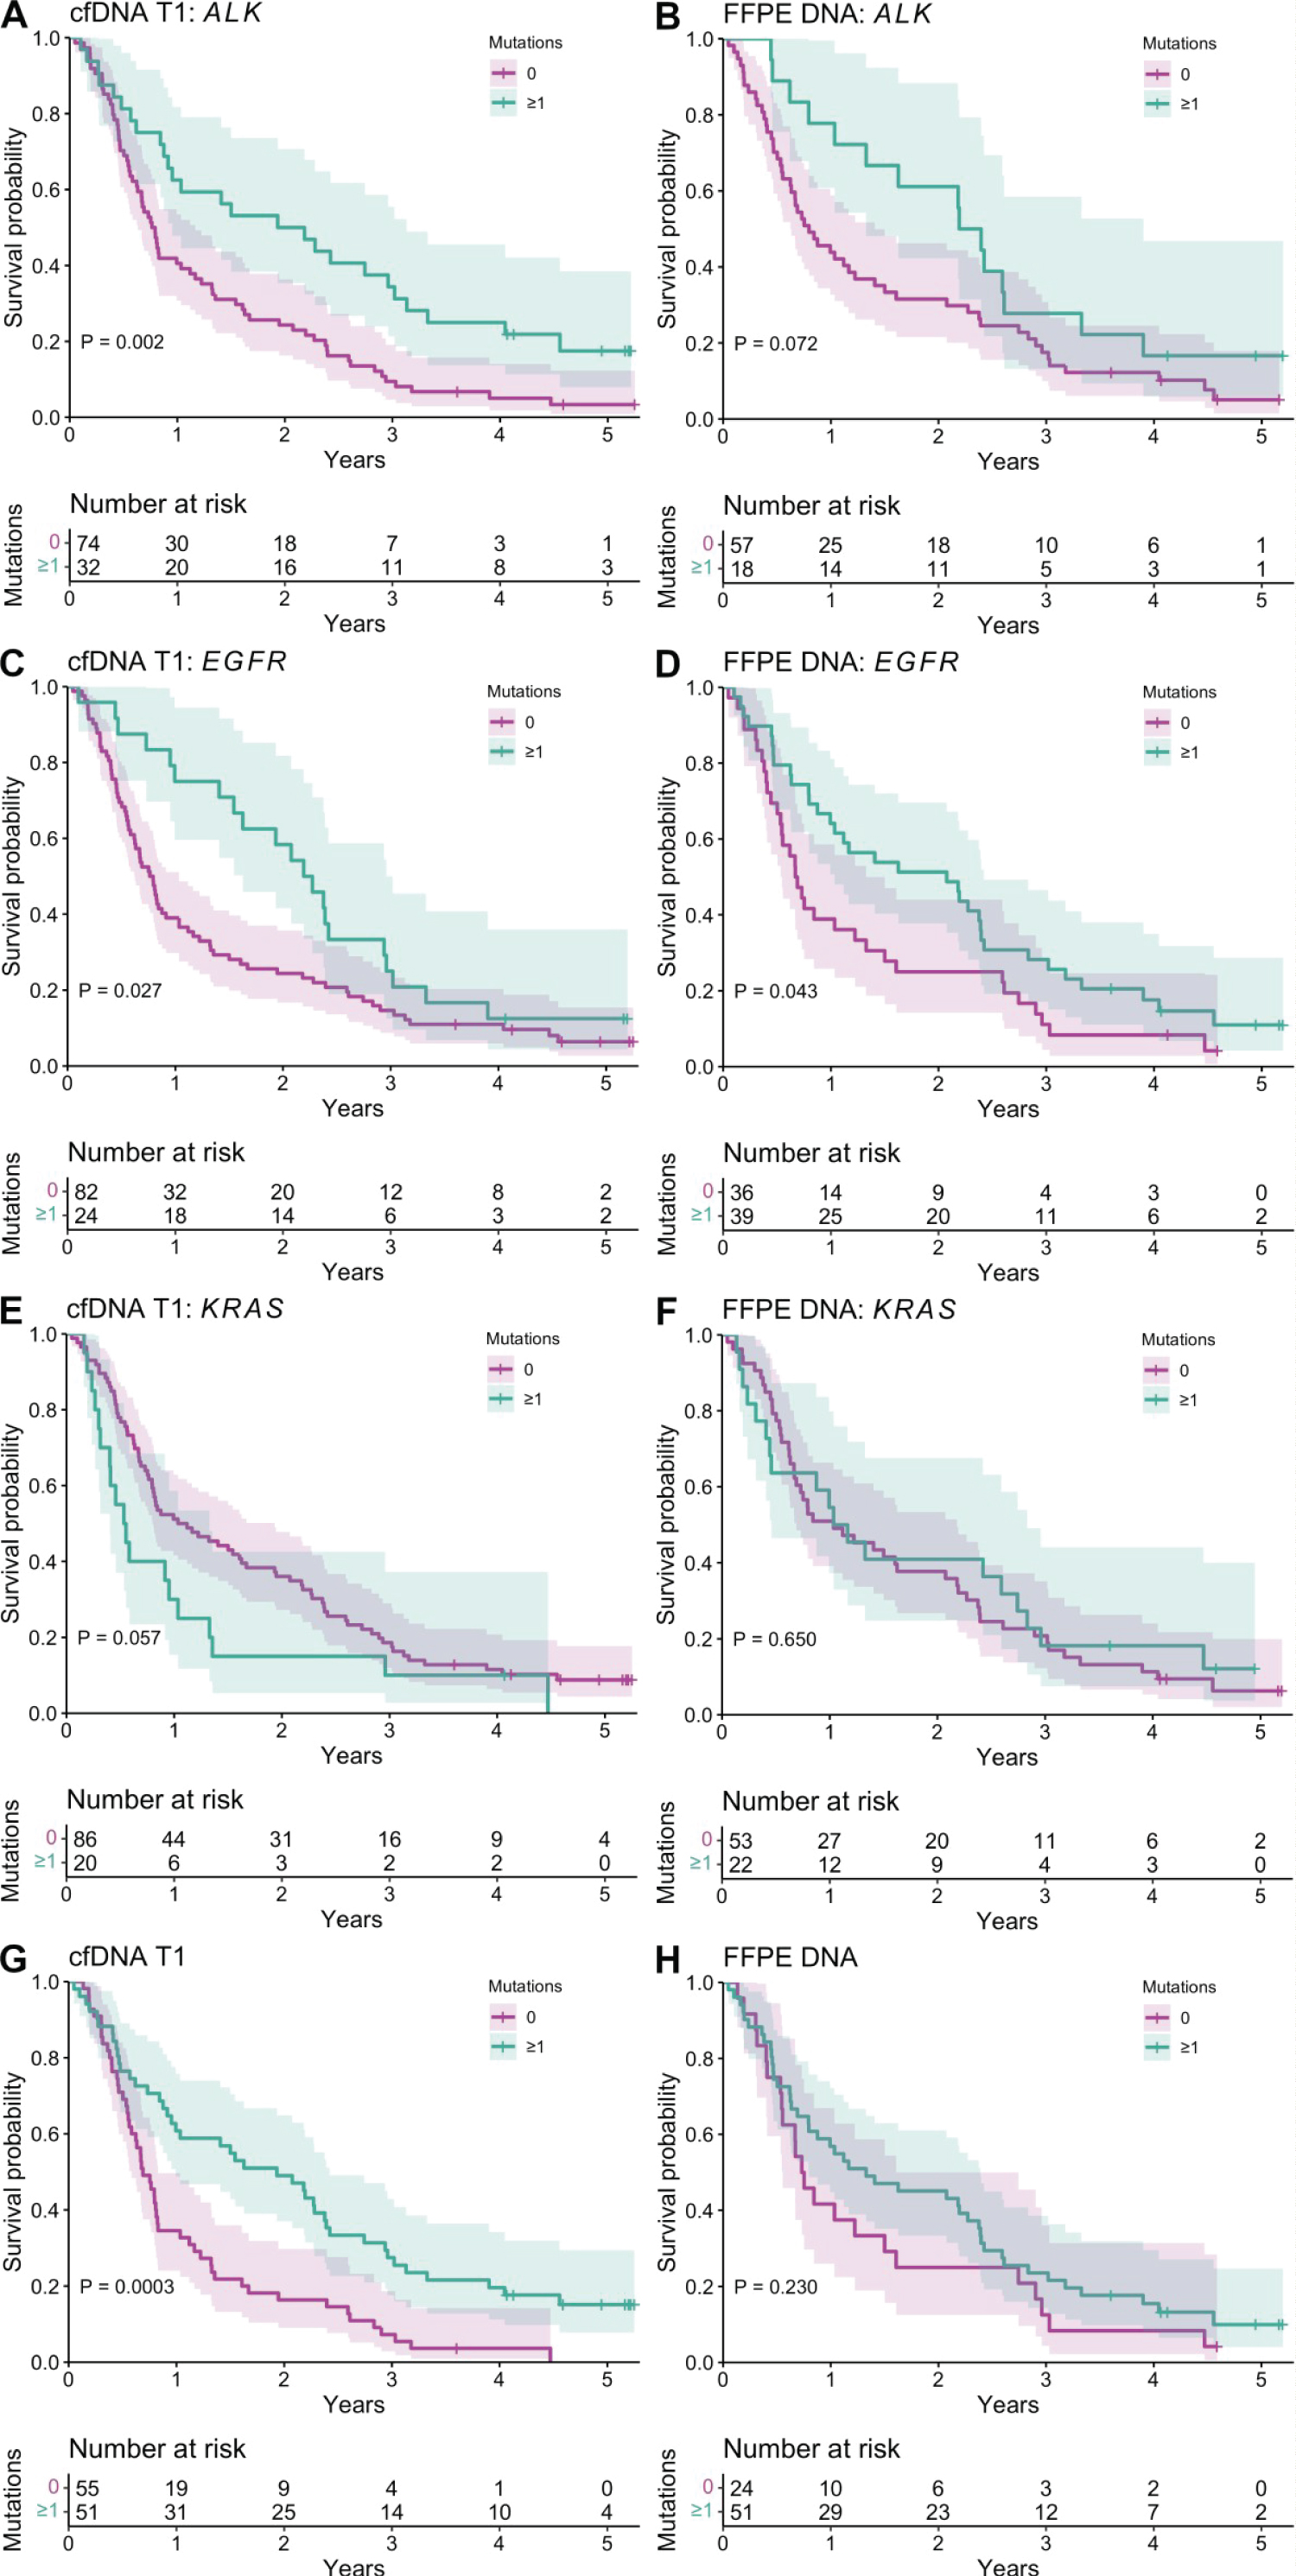 Figure 3: Kaplan–Meier estimates of overall survival according to mutations detected in baseline cell-free DNA (cfDNA T1; n = 106) and formalin-fixed paraffin-embedded DNA (FFPE DNA, n = 75) samples. A,B) ALK mutations; C,D) EGFR mutations; E,F) KRAS mutations; G,H) mutations in eight genes (ALK, AKT1, BRAF, EGFR, ERBB2, MET, NRAS, and PIK3CA).
View Figure 3
Figure 3: Kaplan–Meier estimates of overall survival according to mutations detected in baseline cell-free DNA (cfDNA T1; n = 106) and formalin-fixed paraffin-embedded DNA (FFPE DNA, n = 75) samples. A,B) ALK mutations; C,D) EGFR mutations; E,F) KRAS mutations; G,H) mutations in eight genes (ALK, AKT1, BRAF, EGFR, ERBB2, MET, NRAS, and PIK3CA).
View Figure 3
For cfDNA obtained at T1, the survival of patients with mutations of VAFs < 5% was significantly better than that of patients with no mutation and patients with mutations of VAFs ≥ 5% (P = 9.61 × 10⁻⁵; Supplementary Results F5). Survival did not differ between patients with synonymous, inframe indel, intron, and/or stop gained mutations and those with missense mutations, but patients with no mutation in the current dataset had significantly shorter OS (P = 0.001; Supplementary Results F6). For FFPE DNA, no significant difference was observed between VAF groups (P = 0.340) or mutation groups (P = 0.470).
In univariate Cox models, survival was not associated with age (HR = 0.984, 95% CI 0.965–1.004, P = 0.127) or disease stage (IV vs. IIIA: HR = 0.707, 95% CI 0.341–1.465, P = 0.350; IV vs. IIIB: HR = 0.711, 95% CI 0.328–1.540, P = 0.387), but males (HR = 1.510, 95% CI 1.009–2.258, P = 0.044) and smokers (HR = 2.076, 95% CI 1.189–3.625, P = 0.010) had significantly poorer OS.
All the associations with detected mutations but EGFR remained significant after sex-adjusted Cox multivariate survival analysis (Table 2). Presence of mutations in cfDNA revealed a hazard reduction of 52% in ALK (HR = 0.476, 95% CI 0.300–0.755, P = 0.002) and in overall (HR = 0.477, 95% CI 0.313–0.727, P = 0.0006). In baseline cfDNA, the relative risk of death in patients with mutations of VAFs ≥ 5% was 3.5 times greater than in those having mutations of VAFs < 5% (HR = 3.510, 95% CI 1.672–7.370, P = 0.0009). We also performed sensitivity analysis for survival analysis in cfDNA using 75 patients with both cfDNA and FFPE measurements and did not observe changes in results compared to the full list of study participants (n = 106).
Table 2: Multivariate Cox regression models. View Table 2
In the multivariate Cox model, higher cfDNA concentrations at T1 (≥ 0.60 ng/μL) were associated with poorer OS (HR = 1.670, 95% CI 1.108–2.516, P = 0.014). cfDNA concentrations at T2 (< 0.75 vs. ≥ 0.75 ng/μL) were not related to OS2 (HR = 1.507, 95% CI 0.581–3.910, P = 0.399; Supplementary Results F7).
Patients in the slow progression cohort (n = 33) had a median treatment time of 826 (95% CI 652–1038) days and median OS duration of 953 (95% CI 830–1144) days. Three (9.1%) of these patients were alive at the end of the study period. Sixteen (48.5%) patients with slowly progressing disease were EGFR positive and 14 (42.4%) of them had received EGFR TKI treatment. All other patients (n = 73) were allocated to the rapid progression cohort, which had a median treatment time of 72 (95% CI 49–98) days and median OS duration of 228 (95% CI 195–290) days. Six (8.2%) of these patients were alive at the end of the study period. Seven (9.6%) patients with rapidly progressing disease were EGFR positive and four (5.5%) of them had received EGFR TKI treatment.
We found that patients with slow progression carried significantly more mutations in cfDNA obtained at T1 than did patients in the rapid progression group (Pearson's chi-squared test P = 0.045; Figure 4). The same trend, although not significant (Pearson's chi-squared test P = 0.208), was observed for FFPE DNA.
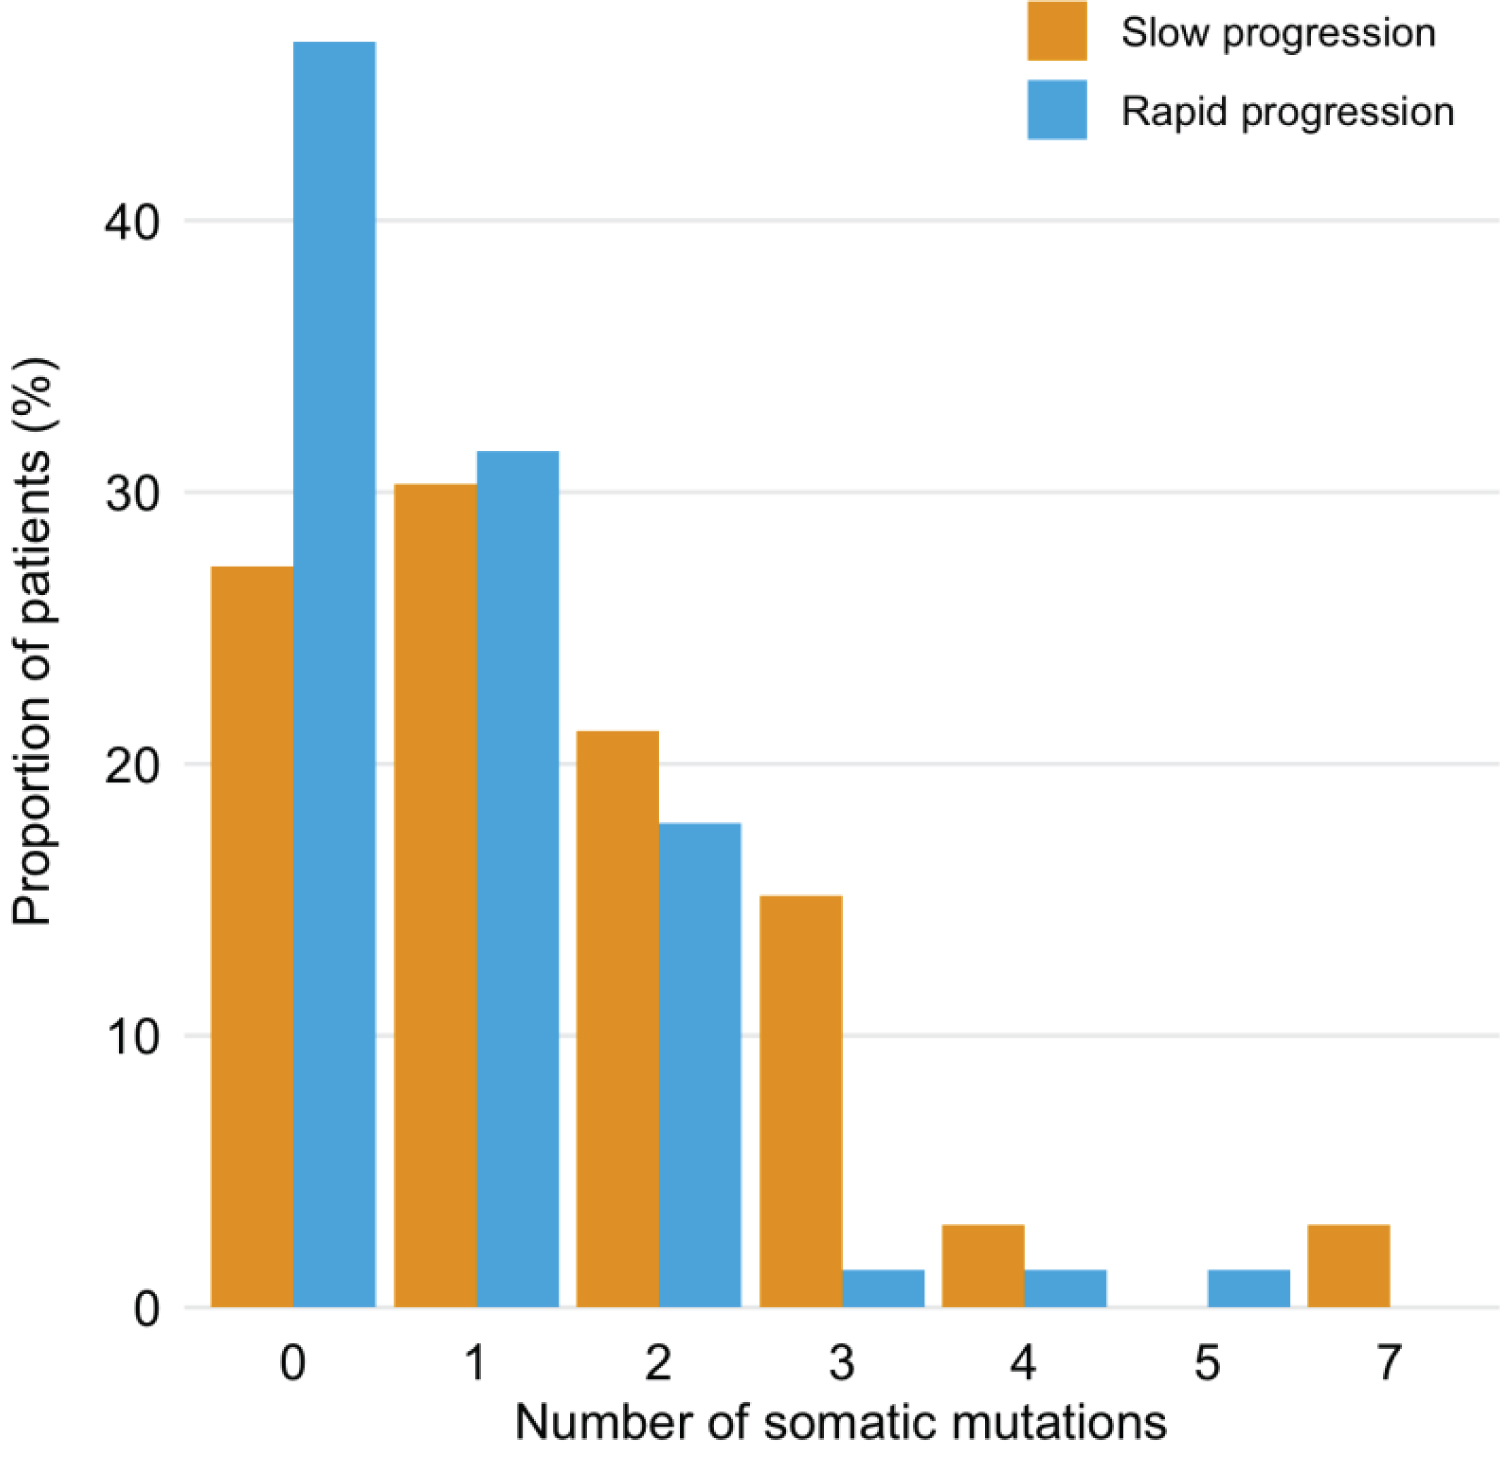 Figure 4: Distribution of mutations detected in T1 cfDNA samples among patients with slow (n = 33) and rapid (n = 73) cancer progression.
View Figure 4
Figure 4: Distribution of mutations detected in T1 cfDNA samples among patients with slow (n = 33) and rapid (n = 73) cancer progression.
View Figure 4
The median interval between collecting T1 and T2 blood samples from 22 patients with cancer progression was 258 (range 92–735) days. Nineteen (86%) of these T1 cfDNA samples harbored at least one (range 0–7) mutation, with a median VAF of 1% (range 0.8–79.4%). Seven (32%) patients had mutations (one mutation, n = 4; two mutations, n = 3) in their T2 cfDNA samples, with a median VAF of 1.3% (range 0.8–53.8%). Relative to the T1 samples, the mutations detected in T2 samples were different or the mutation VAFs were higher (Supplementary Results T5). In the T1 samples, the most frequent mutations were EGFR exon 19 deletions (ex19dels; n = 6) and KRAS p.G12C mutations (n = 3). In the T2 samples, the same KRAS p.G12C mutation and an ALK p.T1151A mutation were detected most frequently (n = 2 each).
Among patients with EGFR ex19dels, two of them were also PIK3CA positive. Patient kA20, who had stage IV cancer, had the EGFR ex19del (VAF = 4.9%) in the T1 sample and the PIK3CA p.E545K mutation (VAF = 0.8%) in the T2 sample. This patient was sensitive to the first-line TKI (erlotinib) treatment, followed by afatinib administration and brain radiotherapy, but then progressed and died after 687 days (OS2) with an OS of 1073 days. Patient kA63, who had stage IV cancer, had the EGFR ex19del (VAF = 12.2%) and PIK3CA p.Q546K mutation (VAF = 7%) in the T1 sample; these mutations were also detected in a matched FFPE DNA sample (with VAF 35.9% and 22.9%, respectively) and in the patient's T2 cfDNA sample (with VAF 53.8% and 45.1%, respectively). The patient received EGFR TKI treatment with afatinib, showed cancer progression after 159 days on first-line TKI, and had OS2 duration of 12 days.
Two patients (kA51 and kA38) had KRAS p.G12C mutations in T1 and T2 samples, with higher VAFs after progression. Patient kA51 progressed on first-line platinum treatment, whereas patient kA38 responded to platinum and pemetrexed followed by pemetrexed maintenance and then progressed rapidly. These patients' OS times were 149 and 495 days (OS2 times, 29 and 31 days), respectively. Patient kA40 also had the KRAS p.G12C mutation, but in the T1 sample, and had OS and OS2 times of 1633 days and 1057 days, respectively. This patient was sensitive to platinum-based chemotherapy (cisplatin and pemetrexed followed by pemetrexed maintenance as first-line treatment), and received eight cycles of atezolizumab at progression.
The prognostic value of cfDNA and FFPE DNA targeted analyses has rarely been compared, and existing studies are characterized by differences in design, mutation detection techniques, and endpoints. Our retrospective patient follow-up study was performed to compare the performance of cfDNA and FFPE DNA analyses. We analyzed plasma samples from 106 patients with lung cancer; matched FFPE tumor tissue samples were available for 75 of these patients and T2 cfDNA samples were collected from 22 patients.
We confirmed that elevated cfDNA concentrations were associated with significantly worse OS. This finding is in agreement with those from several recent studies, which have revealed correlations between high cfDNA levels and poor survival [31-33]. Tissot, et al. [31] showed that the baseline cfDNA concentration can be used as an independent prognostic indicator for NSCLC, with median OSs of 10 and 14.2 months for patients in the highest and lowest cfDNA concentration tertiles, respectively. Similarly, we observed more than twice as long median OS for patients in the lowest cfDNA concentration than those in the highest tertile (516 and 250 days, respectively). More specifically, Hyun, et al. [34] reported positive correlations of cfDNA levels with the metabolic tumor volume and total lesion glycolysis. Our finding provides additional support for the monitoring of the cfDNA level to identify patients who may benefit from more aggressive treatment.
The number of tumor-specific variants detected depends on VAF filtering. Whereas mutation calling is sensitive to the VAF in the tumor samples and calling algorithm, we solve it by combining results from different callers [35-37]. At the cfDNA or FFPE DNA/buffy coat DNA VAF ratio threshold of 3, almost all variants that remained had VAFs > 0.8%. Thus, we considered the variants to be truly tumor specific and examined variants with VAFs > 0.8% in further analyses. We detected mutations in selected regions in 59% of T1 cfDNA samples (median VAF = 1.1%), 80% of FFPE DNA samples (median VAF = 1.2%), and 32% of T2 cfDNA samples (median VAF = 1.3%).
The presence of EGFR mutations is known to be a good prognostic factor [38-40], perhaps due to the more frequent presence of EGFR mutations in nonsmokers and women [41], and the association of these mutations with better responses to targeted therapies, as seen in our study cohort. Among our preselected patients, 21.7% had EGFR TKI–sensitive mutations; this percentage is slightly larger than reported previously for other European cohorts [42-44]. All patients with these mutations in our study were diagnosed with stage IV cancer and had adenocarcinoma histology (excepting two patients with NSCLC histology). Patients who were EGFR positive based on diagnostic laboratory results received EGFR TKI treatment. By analyzing cfDNA samples from T1 and T2, we showed that targeted EGFR TKI treatment was effective, as no EGFR TKI–sensitive mutation was detected in the T2 cfDNA samples. One case of resistance to TKI therapy could be explained by the co-occurrence of EGFR and PIK3CA mutations at baseline. PIK3CA mutations have been associated with decreased responses to EGFR TKIs previously [45-48]. From the p.T790M–positive patient, a biopsy sample was taken 2 years before collecting the baseline blood sample for our study. Based on the biopsy findings, the patient received TKI treatment; 1 year later, continuous disease progression against the background of treatment was detected. By analyzing cfDNA sample from this patient, we showed that in order to determine the need for treatment change, easily obtainable repeat biopsy is needed.
As our amplicon-based analysis did not enable the detection of genomic rearrangement, we could not determine the presence of ALK translocations, observed in a small fraction (3–7%) of patients with NSCLC [49]. However, as the fraction of patients with ALK mutations in our study was much larger [n = 44 (41.5%)] than the expected fraction of patients with ALK rearrangement, the effect of ALK mutation is likely independent from that of genomic ALK rearrangement. In line with published results regarding ALK translocations [50], OS was significantly better in patients with ALK mutations in our study.
The effect of KRAS mutations on survival has been associated with specific mutation subtypes, and results regarding this effect have often been inconclusive [51]. The number of individuals with KRAS variants in our study was too small for mutation-specific analysis. All KRAS mutations combined tended to be associated with shorter survival times, but this association was not significant. The analysis of T1 and T2 cfDNA samples revealed that one patient responded to systemic anticancer treatment despite the presence of KRAS p.G12C mutation. This patient had an OS duration of 1633 days, one of the longest in our cohort. The patients with elevated KRAS p.G12C content in T2 cfDNA samples lived only about 1 month after the diagnosis of progression; their OSs and treatment times were also short. The co-existence of other alterations likely explains the difference in responses to platinum-based treatment. We did not analyze the STK11 mutation in this study, but recent data indicate that this mutation in KRAS p.G12C–positive lung cancer confers resistance to immunotherapy [52]. Due to recent developments and emerging targeted treatments for KRAS mutations, the testing of patients with NSCLC for these mutations is recommended [53-55].
In this study, 31.1% of patients displayed slow cancer progression, with a median OS of 2.6 years and median treatment time of 2.3 years. The presence of more mutations in the slow progression cohort could reflect the accumulation of passenger mutations over time. EGFR alterations explained almost half of the cases of slow progression. Further studies are needed to identify other clinically important mutations, other than the amplicons examined in this study, that could clarify the good treatment responses and longer OSs in the remaining half of cases.
The key finding of this study was that cfDNA analysis has more prognostic value for OS and the cancer progression rate than does FFPE DNA analysis. It may be related to the limited tumor representativeness of FFPE tissue samples and to fixation-related artifacts in FFPE DNA. DNA extracted from FFPE samples is known to contain artifactual mutations [56] caused mainly by cytosine deamination and manifesting as C > T|G > A substitutions. The likely presence of artifacts is supported by our finding of twice the number of mutations per person in FFPE DNA than in cfDNA T1 and about 1.5 times more C > T|G > A substitutions in FFPE DNA than in cfDNA samples; in addition, only 17.2% of the mutations found in FFPE DNA were present in cfDNA T1 and two of the called mutations have been described as possible artifacts. Thus, filtering does not appear to eliminate all FFPE-related sequencing artifacts.
Our findings must be interpreted considering the limitations of our study. We sequenced only selected amplicons from a small number of genes potentially associated with lung cancer in a single signaling pathway. Thus, we could not estimate the effects of mutations and genomic rearrangements (e.g., ALK fusion and MET amplification) beyond the targeted regions. In addition, FFPE tissue and T2 cfDNA samples were available for only a subset of the patients in our cohort. Most (68.2%) of the patients in our cohort with disease progression had no cfDNA mutation in the selected amplicons at T2; they must have had clinically relevant mutations in genes not included in our panel. Despite these limitations, our study demonstrates that the affordable amplicon-based sequencing of cfDNA is efficient, with prognostic performance superior to that of FFPE DNA analysis, in the context of advanced lung cancer.
In conclusion, cfDNA analysis of even a limited set of genes, as performed in this real-world clinical cohort of patients with lung cancer, has a significant prognostic value with a likely clinical utility. Wider genomic testing could improve our understanding of treatment resistance and susceptibility. Only half of the cases with slow progression in our cohort were explained by the response to EGFR-targeted treatment. The co-occurrence of EGFR and PIK3CA at baseline likely explains resistance to TKI therapy. Whether the KRAS p.G12C mutation confers resistance to systemic anticancer treatment likely depends on the co-occurrence of other alterations. FFPE biopsy DNA analysis does not have the best prognostic performance due to fixation artifacts and tumor heterogeneity. We recommend cfDNA mutation assessment as part of future standard management of lung cancer.
This research was supported by the European Union through the European Regional Development Fund (project no. 2014-2020.4.01.15-0012) and Estonian Research Council (PUT PRG555, PUT736). The authors declare no conflicts of interest and acknowledge all clinical and research colleagues contributing to the study. We'd like to thank the advanced cancer patients involved in the current study for donating their blood samples, and Jennifer Piehl for critical reading of the manuscript.
This research was supported by the European Union through the European Regional Development Fund (project no. 2014-2020.4.01.15-0012) and Estonian Research Council (PUT PRG555, PUT736).