Non-communicable diseases (NCD) are rising throughout the globe over the last few decades. Developing countries bear the worse burden of these NCD. Similarly, low birthweight is increasing around the world where most of this prevalence commonly seen in the developing countries but as well in the well-developed countries where advancement of health care managed to increase the survival of the very low birthweight babies.
In recent years, there has been great interest in the early development of the foetus and the impact of growth during the gestational period on the development of diseases in later life, and in particular that termed a 'critical period'. The 'critical period' of growth of the kidney is the rapid growth period that starts from the ninth week of gestation onwards, which is determined by rapid cell division. Disproportionate growth of different organ systems in utero can occur because different tissues have different critical periods of growth at different times.
LBW, which reflects adverse effects on development in the uterus, contributes to this phenomenon of disease programming in early life. It is not only the presence or absence of genes that control our destiny, but the way in which gene expression may be permanently changed by, for example, the nutritional environment in early life. Many epidemiological findings suggest that the risk of disease in adult life is programmed, and/or imprinted by the environment encountered before.
The role of small size at birth with low number of cells may contribute to various NCD problem. Post-natal environmental factors further compound such a metabolic demand on body organs that lead to various organ function being overwhelmed with increase in metabolic rate. Hence this leads to increase demand upon various structures, such as nephron with hyperfiltration, organ dysfunction ensues. Hence, an early strategy health program is of great importance to be instituted to detect major risk factors which may arise early in life in those with LBW and or prematurity.
Non-communicable Chronic diseases, such as diabetes, high blood pressure and kidney disease, are increasing rapidly in many populations globally. Poverty and socio-economic disadvantage, together with lifestyle and dietary changes are significant contributing factors [1,2].
Thrifty hypothesis proposes that type 2 diabetes mellitus (T2DM) and numerous components of metabolic syndrome consequence from derisory intrauterine environments for best fetal growth. Numerous studies have confirmed an increased risk of diabetes or impaired glucose tolerance in relation to low birthweight (LBW) [3]. In spite of number of critics, thrifty phenotype has modulated an important role for genetic factors in the aetiology of T2DM and concluded that "environmental, undoubtedly nutritional factors operating in early life play a chief causative part in T2DM and other components of metabolic syndrome.
Barker, et al. stated that T2DM and high blood pressure have a shared origin during growth in sub-optimal development in utero, and that syndrome X ought to be called "the small-baby" syndrome [4]. It is proposed that the association between LBW and various metabolic syndrome components including diabetes development in adulthood reflects the long-term effects of decreased growth of the endocrine pancreas cells, kidney cells and other tissues in utero, which may be a consequence of maternal undernutrition.
People with normal kidney function have nephron mass more than that necessary to maintain a normal glomerular filtration rate (GFR ≥ 90 ml/min). Thus, with progressive loss of kidney mass, that loss initially is the kidney reserve, which is not reflected by a rise of serum urea and serum creatinine levels or in a disturbance of homoeostasis. If the progression continues, this stage is followed by kidney insufficiency, which is associated with mild elevation of serum urea and creatinine levels and mild symptoms, including nocturia and fatigability. With further progression, kidney failure ensues. This stage is characterised by apparent abnormalities of kidney excretory function, including disturbances in water, electrolyte and acid base metabolism.
Continued worsening of kidney function is followed by the 'uremic syndrome', which includes multiple dysfunctions of major organ systems in addition to the abnormalities of excretory function described. Finally, end stage kidney disease (ESKD) appears, at which time the remaining kidney function is unable to sustain normal body function. Kidney replacement therapy (dialysis or transplant) is required. Recently, this last stage is termed stage 5 where GFR < 15 ml/min. Table 1 shows the stages of chronic kidney disease (CKD) as classified by Kidney Disease Outcomes Quality Initiative (K/DOQI) of the National Kidney Foundation (NKF) [5].
Table 1: NKF-K/DOQI classification of the stages of chronic kidney disease (CKD). View Table 1
The NKF-K/DOQI work group defined CKD as the presence of kidney damage or GFR < 60 mL/min/1.73 m2 for 3 months or more, irrespective of diagnosis (Table 1). Kidney damage is usually identified by the presence of markers of disease that are present in blood, urine, or imaging studies, rather than by kidney biopsy. The CKD guidelines emphasize persistent proteinuria as a particularly important marker of kidney damage. The rationale for including individuals with normal GFRs is that substantial kidney damage often occurs before this pivotal component of kidney function declines, and that these individuals are at increased risk for adverse outcomes of CKD. The rationale for including individuals with GFR < 60 mL/min/1.73 m2 without any other evidence of kidney damage is that reduction in kidney function below this level represents loss of at least 50% of normal kidney function, a level at which the prevalence of complications of CKD begins to increase. The 5 different CKD stages shown in Table 1 generally correspond to both the severity and the nature of the expected complications of CKD. Kidney failure (CKD stage 5) is defined as either 1) GFR < 15 mL/min/1.73 m2, or 2) need for the initiation of kidney replacement therapy (dialysis or transplantation).
In Oman, the incidence and prevalence of CKD is increasing progressively overtime. The incidence of ESKD on RRT was 21, 75, and 120 per million population in 1983, 2001, and 2013, respectively. Similarly, the prevalence of ESKD was 49, 916, and 2386 in 1983, 2001, and 2013 respectively [1,2]. As of 2013, the USRDS reported that the lowest treated ESKD incidence rates ranged from 45 to 96 PMP in Bangladesh, Russia, Estonia, Iran, Iceland, Ireland, Finland, Switzerland, and Scotland. This is lower than the incidence rate of 120 PMP calculated for Oman in 2013. However, other countries such as Taiwan, the Jalisco region of Mexico, and the United States reported the highest incidence of treated ESKD, at 458, 421, and 363 PMP, respectively. Similarly, the incidence and prevalence of end-stage kidney disease (ESKD) in Australia has been increasing over the past decade, with an overall increase of 7% and 6% respectively. In 1991, there were 57 new cases per million, and by 2003 it had increased to 98 new cases per million. There were 13,625 patients (685 per million) receiving kidney replacement therapy at 31 December 2003. Of these, 5,951 (299 per million) had a functioning kidney transplant, and 7,674 (386 per million) received dialysis treatment. In 2003, the intake varied from 262 per million populations in the Northern Territory to 75 per million in Tasmania. This was an increase of 3% from 2002, and the number of patients increased in all states [6-9].
Earlier stages of chronic kidney disease (CKD) are more prevalent as the tsunami of NCD spreading through the world and may be even more costly than ESKD. In Oman, one percent of population aged 40 years and over have severe renal failure (GFR < 30 mls/min/m2), 9% have moderate renal failure (GFR 30- < 60 mls/min/m2) and 29% have mild renal failure (GFR >= 60 and < = 90 ml/min/m2) [2]. Projections based on data from the Australian Diabetes, Obesity and Lifestyle Study (AusDiab) suggest that 1.4 million Australian adults (11.4% of the non-institutionalised population) had CKD stages 3-5 in 2000 [9]. For the 99% with CKD who were not receiving dialysis or had not had a transplant, two major consequences have become apparent: increased risk of developing ESKD and increased cardiovascular risk compared with the normal population. Both of these risks are associated with a progressive increase in mortality rate through successive stages of CKD, as was demonstrated in a longitudinal study of subjects in a large health maintenance organisation in the United States (figures represent 5-year mortality rates): no CKD, 10.2% ± 0.5%; stage 2, 19.5% ± 1.9%; stage 3, 24.3% ± 0.8%; stage 4, 45.7% ± 3.5% [10]. Indeed, overwhelming evidence now shows that CKD is an independent risk factor for cardiovascular disease and should be added to the list of "traditional" risk factors [11].
There are problems in classifying 'causes' of CKD and ESKD. Current classification systems were developed to classify ESKD cases accepted onto RRT. In Oman, all cases with ESKD and those on RRT are reported mandatory to a central office. However, CKD is not yet reported on a mandatory basis. The three main Registry groups United States Renal Data System (USRDS), Australia New Zeeland (ANZDATA), and European (EDTA) have some variation in the coding systems used but they can be grouped [12] as shown in Table 2.
Table 2: Criteria for the definition of chronic kidney disease (CKD). View Table 2
The three main causes of kidney disease in Oman were diabetes, hypertension and glomerulonephritis. During 2013, diabetes was the leading cause of ESKD (46%), followed by hypertension (22%), and chronic glomerulonephritis (18%) [1,2,13]. Among patients with ESKD on renal replacement therapy (RRT), a progressive rise was seen in diabetic nephropathy, with 5.8%, 32.1%, and 46% in 1983, 2001, and 2013 respectively [1,2,13]. Also, in Australia, the main causes were diabetes (32%), glomerulonephritis (24%) and hypertension (14%) [14]. As shown in Table 3 the prevalence of diabetes in the Australian population aged 25 years and older was 7.5%: 8.0% for males and 7.0% for females. The prevalence of diabetes rose from 2.5% in people 35 to 44 years to 23.6% in those over 75 years and over. The prevalence of impaired glucose metabolism (being either impaired glucose tolerance or impaired fasting glycaemia) in the population was 16.3%: 17.3% for males and 15.3% for females [15,16]. In Oman, the distribution of chronic diseases and related risk factors among the general population is similar to that of industrialized nations: 12% of the population has diabetes, 30% is overweight, 20% is obese, 41% has high cholesterol, and 21% has the metabolic syndrome [17].
Table 3: Prevalence of chronic diseases as reported by the 1999 AusDiab study. View Table 3
The prevalence of being mildly overweight (BMI 25-29.9 kg/m2) was 39.1%: 48.2% for males and 30.2% for females. The prevalence of obesity (BMI ≥ 30 kg/m2) was 20.5%: 19.1 for males and 21.8% for females. The prevalence of hypertension was 28.8%: 30.6% for males and 27.1% for females. The prevalence of elevated total cholesterol (≥ 5.5 mmol/l) was 51.2%: 51.1% for males and 51.2% for females [15,16].
Essential hypertension is multifactorial in origin, with both genetic and environmental components interacts together to. Numerous epidemiological studies have found that LBW is linked with increased blood pressure throughout life including infancy [18], childhood [19-21], childhood-adult [22-25] and adult life [3,26,27]. The probability of an hostile outcome is significantly amplified in those born with LBW, who later grow as obese or an increased ponderal index (weight × 100] ÷ [length3]). On the other hand, those born with LBW, who continue to be small or thin, are comparatively spared in term of metabolic demand in adult life [28]. Various mechanisms interaction in the pathophysiology role of the association between body-size and elevated blood pressure. Firstly, obesity and central body fat mass damages microvascular function that, in turn, may leads to the development of hypertension. Secondly, obesity leads to an increase secretion of inflammatory indicators such as adipokines and cytokines, in addition to the rise of C-reactive protein (CRP) levels; a marker of inflammation which restrict the normal physiological process, leading to high blood pressure [29-32].
The first, in utero, environment is very important in determining the subsequent risk of the development of chronic diseases [33-35]. LBW, which reflects adverse effects on development in the uterus, contributes to this phenomenon of disease programming in early life. It is not only the presence or absence of genes that control our destiny, but the way in which gene expression may be permanently changed by, for example, the nutritional environment in early life. Many epidemiological findings suggest that the risk of disease in adult life is programmed, and/or imprinted by the environment encountered before.
A small for gestational age infant is any infant whose birthweight is below the 10th percentile for gestational age, whether premature, full term, or post mature [36]. Despite their small size, a full-term small for gestational age (SGA) infant does not have the problems related to organ system immaturity that the premature infant has.
LBW may be due to intra-uterine growth retardation (IUGR), prematurity, or both; epidemiological studies do not always separate the two conditions. LBW is a key indicator of health status throughout the world. Prematurity is defined as a gestational age of less than 37 weeks. LBW is defined as a birthweight less than 2,500 grams. Babies weighing less than 1,500 grams are categorized very low birthweight (VLBW) and those less than 1,000 grams as extremely low birthweight (ELBW). IUGR is defined as a birthweight below the 10th percentile for gestational age [36]. There are different types of IUGR, but the most common is type 2, which is characterised by a disproportionately large head, small abdominal viscera, and a lack of subcutaneous fat. The association between birth phenotype and adult disease extends across the normal range of birth size, suggesting that even subtle influences, as reflected in the normal range of birthweights, are sufficient to alter the propensity for adult disease.
The Barker hypothesis states that there is an association between LBW and the development of hypertension and cardiovascular disease in adult humans [33]. It asserts that adverse factors encountered during foetal life have the dual effect of perturbing prenatal growth patterns and establishing a pre-susceptibility to major disease in adult life. Barker and colleagues found a similarity between the geographical distribution of mortality from cardiovascular disease in England and Wales and a pattern of maternal and neonatal mortality [37,38]. They also demonstrated an association between those with the lowest weight at birth, or at 1 year of age, and deaths from ischaemic heart disease in later life.
In recent years, there has been great interest in the early development of the foetus and the impact of growth during the gestational period on the development of diseases in later life, and in particular that termed a 'critical period'. The 'critical period' of growth of various organs including the kidney is the rapid growth period that starts from the ninth week of gestation onwards, which is determined by rapid cell division. Disproportionate growth of different organ systems in utero can occur because different tissues have different critical periods of growth at different times.
Undernutrition, occurring for whatever reason, slows cell division, either as a direct effect or through altered concentrations of growth factors or hormones, and may permanently reduce the number of cells in particular organs [39,40]. A less than optimal diet in pregnancy can induce foetal adaptations that include permanent alterations to cell numbers and type within key organs and subsequent modulation of gene expression [41]. Undernutrition can have persisting defects, which include reduced cell numbers in tissues and organs, modified organ structure, selection of particular clones of cells and altered settings of key hormonal axes.
Human embryonic kidneys develop in three consecutive structures: the pronephros, mesonephros, and the metanephros. The pronephros disintegrates and the mesonephros and metanephros then link, as the vestiges of the mesonephros form the ureteric bud that induces development of the kidney from the metanephric cap. A complex hormonal action causes nephron branching that culminates in final nephron formation [42].
Nephron development starts early in gestational life. The nephrogenesis process is completed by the 36th week of gestation, after which no more nephrons form (Figure 1). Approximately 60 per cent of nephrons develop during the third trimester of pregnancy [43-45]. Nephron generations arise one after another as new branches of the ureteric tree form and progress towards the periphery of the mesenchymal mass. Since this process continues until the 36th gestational week, it has been suggested that a suboptimal intrauterine environment and a pre-term birth, (both of which are associated with LBW), might adversely affect nephron development [46] (Figure 2).
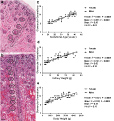 Figure 1: Linear regression analysis of nephrogenic zone width versus gestational age in female (O) and male from 20 to 41 weeks of gestation [74].
View Figure 1
Figure 1: Linear regression analysis of nephrogenic zone width versus gestational age in female (O) and male from 20 to 41 weeks of gestation [74].
View Figure 1
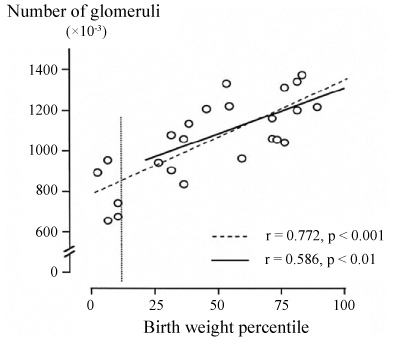 Figure 2: The relationship between the number of nephrons and birthweight in humans.
The vertical line indicates the 10th birthweight percentile. Note that the correlation remains within the range of normal birthweight [75].
View Figure 2
In full-term pregnancy, LBW, caused by delayed foetal growth, is often accompanied by a decrease in the number of nephrons (20%-¬35%) [45,47,48]. The interaction between the effect of perinatal influences and classic postnatal risk factors is still far from clear. With ageing, prenatal influences could act to amplify the effects of classic risk factors. Multiple factors during pregnancy and perinatal period appear to affect organogenesis. Subsequently, these may translate and pre-set these effects, such as low nephron number and dyslipidemia, to being more likely to have a variety of health problems such as hypertension, and cardiovascular or kidney disease at puberty and adulthood.
Researchers have examined the kidneys of patients who had primary hypertension and died in accidents [49]. The researchers reported that the nephrons number was reduced in Caucasian patients with primary hypertension. It is not only a decreased nephron number that is responsible for hypertension, but the actual compensatory maladaptive changes that occur within nephrons when nephrogenesis is compromised. In addition, the inverse association between birthweight and systolic blood pressure is amplified with age, with longitudinal blood pressure measurements during adulthood, and the association was mostly accounted for by current weight [26,28,50,51]. The observation on the age augmentation of the consequence of birthweight shows that the foetal programming and the increasing load of unhealthy lifestyle behaviours affect the development of adult hypertension in a synergistic way [52]. There are suggestions that ethnicity may adjust the association between measures of body size and blood pressure [53]. Ethnic differences in these associations might be due to differences in body composition, a parameter frequently compared between ethnic groups.
The "thrifty hypothesis" suggests that insufficient nutrition drivers the foetus to develop resistance to an insulin-stimulated uptake of glucose in late life [54-59]. This inverse relationship between LBW and, impaired glucose tolerance and elevated serum insulin, occurs across a whole range of ages and in both sexes and racial backgrounds [3,58-63]. It may be determined by a genetic defect in insulin action that manifests itself in utero as reduced growth, and in later life as an impairment of an insulin-stimulated uptake of glucose especially with higher body size than that sensed in early life. In this setting it is projected that the ill-nourished mother essentially gives the foetus a forecast of the nutritional environment into which it will be born. Various metabolic processes and pathways are set in motion, leading to a postnatal metabolism adapted to survive the conditions of poor nutrition. The adaptations only become detrimental when the postnatal environment differs from the mother's forecast, with an overabundance of nutrients and consequent obesity [60].
Also, researchers found that there is a significant and specific inverse relationship between birthweight and the risk of cardiovascular (CVD) in adulthood [64-67]. In humans, reduced growth before birth is also associated with altered left ventricular mass [68], with IUGR foetuses having a larger heart relative to their body weight [69]. Left-ventricular-hypertrophy (LVH) in adulthood is also linked with harmful CVD outcomes [70]. These relationships demonstrate the importance of early childhood conditions for later-life outcomes.
Researchers review of 16 observational studies reported that a 1 kg higher birthweight being associated with a 10-20% decrease in risk of subsequent ischemic heart disease [64]. The prevalence of coronary heart disease (CHD) is associated with low infant weight within each social class and in both smokers and non-smokers in men born during 1920-30 in Hertfordshire in England [71]. In the same study of men born in Sheffield found that individuals who were small at birth were at higher risk for CVD, and the trends were paralleled by similar trends in its major risk factors, namely hypertension and non-insulin-dependent diabetes [4].
There are many reports that LBW, < 2.5 kg, predisposes to many diseases including hypertension, diabetes, cardiovascular diseases and kidney diseases. However, most previous studies found a significant relationship when adjustments were made for body mass index (BMI) or current body weight [72,73]. Many of these studies that had examined the effect of birthweight on the development of chronic diseases were done in selected populations. Also, they were based on a localized national geographical location, ethnicity, and or by professional status. None had looked at a cluster of these diseases in a nationally representative population. Therefore, there is a need for each population to evaluate the effect of in utero programming on the development of NCD. Most importantly, in developing countries and in our region in particular where the NCD has reached a stage of epidemic.
Various metabolic risk factors such as obesity, diabetes, dyslipidaemia and high blood pressure have been related to low birthweight. These metabolic risk factors act negatively on the nephrons and various other vascular structures that already being compromised as a consequence of low birthweight. This risk multiplications of LBW tend to deteriorate organ function more progressively as shown in organ such as the kidney. These various metabolic factors double impacts further deteriorate that already reduced number of nephrons and hence further deterioration in kidney function leading to various metabolic deterioration and abnormalities including proteinuria and CKD. This continues in a vicious cycle of further reduction in nephron and worsening proteinuria that end up with end-stage chronic kidney disease. The same vicious cycle of deterioration occurs among other organs as the metabolic demand of the body increases with obesity and higher metabolic demand.
The role of small size at birth with low number of cells may contribute to various NCD problem. Post-natal environmental factors further compound such a metabolic demand on body organs that lead to various organ function being overwhelmed with increase in metabolic rate. Hence this leads to increase demand upon various structures, such as nephron with hyperfiltration, organ dysfunction ensues. Hence, an early strategy health program is of great importance to be instituted to detect major risk factors which may arise early in life in those with LBW and or prematurity. The logistic and financial requirement may not be huge to put such a strategy forward but definitely this strategy would in long term delay or even ameliorate the progressive rise of NCD. Hence, endorsing healthier lifestyles, body weight, blood pressure and enhancing the family physicians' capability should be required to reduce the burden of NCDs. Findings of various risk factors at early post-natal life, such as proteinuria and treatment with angiotensin converting enzyme inhibitors, will help to better manage this subset of our population that is increasing progressively with advancement of medical care for small babies. Therefore, it is prudent to follow these children by their family physicians in at least a yearly basis to examine their various risk factors and provide an educational strategy from an early life in abide to ameliorate their pre-set disease evolution.