Aim: To assess the impact of the 'radiographic pattern' indicator on changes in clinical and radiological parameters and therapeutic responses to common intra-articular therapies in hip osteoarthritis (HOA) at 8-year follow-up.
Methods: 400 patients, two therapeutic courses - at baseline -month 0 (M0) and M5, were allocated into three observation groups: Normal saline (IA-NS) as a control group - N = 150, 2.0 ml per dose, single injection (SI) for each course (EC); methylprednisolone acetate (IA-CS) - N = 100, 80 mg/2.0 ml per dose, SI for EC; medium molecular weight HA (MMW-HA) - N = 150, 20 mg/2.0 ml per dose, 3 -weekly injections (M0 -W0, W1, W2) for EC. Each of the latter groups was subdivided into 6 subgroups, according to the radiographic grades (RG) - RG -II/III -Kellgren - Lawrence (K/L) and the radiographic patterns (RPs; atrophic - ‘A’; normotrophic - ‘I’; hypertrophic - ‘H’) of the patients, each of them consisted of 25 patients with a fixed gender distribution (F/M ratio = 15/10). The follow-up period was 8 years with assessment of the: Clinical parameters (CPs) - pain on walking (PW by VAS), functional ability (F; by WOMAC - C), patient global assessment (PtGA); laboratory parameters (LPs) - serum CTX-I, urine CTX-II and radiological indicators (RIs) - BMD assessed by DXA, including lumbar spine, total hip and total body; joint space width/joint space narrowing (JSW/JSN) - assessed on an x-ray image. RIs were assessed every 12 months, whereas CPs/LPs - every month until M6 visit, every 3 months until M12 visit, and then every 6 months until M96 visit.
Results: At baseline, within-group comparisons in all groups found statistically significant differences (SSD; p < 0.001) only between the endmost RPs (‘A’ vs. ‘H’), for all CPs, LPs and BMD values in the absence of SSD in mJSW. During the observation, for all groups, SSDs (p < 0.05) were detected between all RPs (‘H’ vs. ‘I’ vs. ‘A’), for all assessed indicators, but at different time points according to applied treatment. Furthermore, between groups comparisons found SSD at М12 in JSN for both stages K/L-II (p = 0.004) /K/L-III (p = 0.003), in all RPs of MMW-HA vs. NS. These findings were accompanied by similar changes in mJSW (p < 0.001) found at M36 and in times to conversions to total hip replacement (tTHR) - MMW-HA vs. NS (p < 0.001). The second course led to cumulation of the effect with an increase in the effect size (ES) and effect duration (ED) of the registered OARSI-responses -for both treatment groups (IA-CS/IA-HA; p < 0.001).
Conclusion: The observed SSD in clinical, laboratory and radiographic indicators between endmost RPs at baseline and between all RPs during the follow-up - support the existence of distinct subgroups of HOA (the ones associated with individual RPs), each of them with their specific characteristics of AC-breakdown and SB-remodeling determining the differences in their clinical and radiographic progressions and their different response to the same intra-articular therapy.Proper time allocation of the second course led to cumulation of the effect with an increase in ES and ED for both groups with a symptomatic effect for IA-CS and probabledisease-modifying effect for MMW-HA.
Hip osteoarthritis, Intraarticular therapy, Osteoarthritis progression, Radiographic grade, Radiographic pattern
OA is a whole joint disease, affecting synovial joints, represented by structural alterations in the hyaline articular cartilage (AC), subchondral bone (SB), ligaments, the joint capsule, synovial tissue (ST), and periarticularmuscles. The complex pathogenesis of OA involves mechanical, inflammatory, and metabolic factors, which eventually lead to the destruction and loss of function of the whole joint [1]. The occurrence and progression of OA of the weight-bearing joints are due to the processes in the osteochondral junction (OCJ) [2,3] and the presence of smoldering synovitis (SS) [4,5] which occurs and is self-perpetuating with the leading role of metabolic inflammation, innate and acquired immunity [6-11]. The changes in each of the two main elements (OCJ/SS) lays the foundation for the need for validation of different subtypes of ОА [6,12,13].
The various therapeutic interventions aimed at symptomatic and/or disease-modifying effects in OA target one or more of the leading mechanisms - AC-breakdown (hyaluronic acid and hyaluronans, regenerative therapies with platelet rich plasma -PRP, mesenchymal stem cells -MSCs); SB-remodeling (bisphosphonates, osteoprotegerin, transforming growth factor -β inhibitors, vascular endothelial growth factor - targeting antibodies or angiogenesis inhibitors) or toward ST/SS (IA - glucocorticosteroids, methotrexate, antiinflammatory cytokines) [1,4,9,11].
Intra-articular therapies in HOA are an important treatment element since they allow the achievement of therapeutic local concentrations of active substances with minimal topical and/or systemic side effects [14]. In addition, arthrocentesis for access to the joint cavity allows the simultaneous performance of diagnostic (aspiration and examination of joint fluid) and therapeutic (joint lavage) procedures. The main rheumatology organizations (ACR; EULAR; OARSI), in their recommendations for HOA therapy, explicitly emphasize the need to use guided arthrocenteses, without giving preference to the guidance methodology - fluoroscopic-contrast guidance (FCG) or ultrasound guidance (USG) [15-17].
The main substances used for intra-articular therapy in HOA are:
Natural saline (IA-NS) - typically used for controls in clinical trials to minimize the placebo effect of the manipulation and the lavage effect of the injected volume (SMD 0.144 (CI 95%; p = 0.020) [18-20]. It should not be forgotten, however, that IA-NS has its own effect, different from placebo, which is a function of the administered volume and is based on the lavage effect at volumes between 2 and 10 ml [19,20].
Intra-articular depot corticosteroids (IA-CS) - widely used due to the possibility of directly affecting the involved joint with minimisation of systemic and side effects characteristic of the group. Their action is mainly aimed at affecting synovitis, but they have a proven effect also in non-inflammatory subtypes of HOA, except for atrophic radiographic patterns, where negative effects on SB -negate their benefits. The current recommendations of the major rheumatology organizations - the International Osteoarthritis Research Society (OARSI) [16] and the American College of Rheumatology (ACR) [17] - from 2019, approve IA-CS only for episodes of disease exacerbation and for short-term improvement of pain and function. The ES and effect duration (ED) over time of IA-CS are a function of: The degree of morphological changes [21,22] - the ES/ED decrease with the progression of the morphological changes at the different radiographic patterns, with the best treatment response being for 'H', followed by 'I', however -'A'-patterns do not respond to IA-CS therapy [22,23]. Presence of synovitis [22,24,25] - the presence of synovitis and hydrops together are predictors for a more pronounced and a long-lasting effect; the dose used - higher doses have a more pronounced and prolonged effect [22,26] and molecule - molecules with longer retention in the joint have a duration of effect of more than 12 weeks (triamcinolone acetonid extended release with microsphere technology) [27].
Intra-articular administration of hyaluronic acid and hyaluronan (IA-HA) - is also widely used due to the possibility of viscosupplementation (VS) with a direct lubricating effect and viscoinduction (VI) - the ability to stimulate the own synthesis of hyaluronic acid, also because of the antinociceptive and reparative effects on AC and SB. The effects mentioned above show a dependence on molecular weight, concentration and stabilization methods of the products used [28-31], as well as the dependence of ES/ED, mentioned in IA-CS, on the degree of morphological changes (negative in IA-HA [24,28,32-35] and the presence of synovitis and hydrops (negative in IA-HA [24,28,35-37]. The latest -2019 OARSI recommendations [16] approve IA-HA only for episodes of disease exacerbation, for short-term pain improvement, and only for the knee joints. The recommendations of the ACR from 2019 are even more negative - "Intraarticular hyaluronic acid injections are conditionally recommended against in patients with knee and/or first carpometacarpal joint osteoarthritis and strongly recommended against in patients with hip OA", arguing with results of meta-analyses showing low effectiveness versus NS-controls [17].
There are intra-articular therapies aimed at affecting AC/SB (IA-PRP, IA-MSCs, IA-TGF-β inhibitors) or ST/SS (IA-anti-inflammatory cytokines, IA-angiogenesis inhibitors) that are not the subject of the article or are still experimental and will not be discussed in detail here.
The three radiological patterns of HOA - atrophic (‘A’), normotrophic or intermediate (‘I’), and hypertrophic (‘H’) - were first described by Solomon in 1976 [38], considering the balance between osteophytes and joint space narrowing on a standard radiographic image. Flanagan, et al. in 1988 [39] and Plant, et al. in 1997 [23] found that ‘A’-patterns of HOA do not respond to treatment with IA-CS due to ‘the low intensity of inflammatory reaction in these patterns and/or the unfavorable effect of IA-CS on bone remodeling’. Later, the occurrence rate of the different patterns and their association with the clinical and radiological progression of HOA were determined [40-42] and a suggestion of presence of different phenotypes in HOA was made [43,44]. The studies on the association between osteoporosis and the pathogenesis and progression of HOA, based on the Rotterdam cohort study [45-47], and others [48] proved that ‘A’-patterns are associated with a low regional (FN-BMD/TH-BMD) and whole body (LS-BMD and TB-BMD) bone mineral density and a rapid radiographic progression, while ‘H’-patterns are associated with an increased local BMD and a slow radiographic progression [45-48]. Currently, HOA radiographic patterns are defined based on the balance between the processes of narrowing of the joint space (as a result of AC - loss) and the processes of SB remodeling with the growth of osteophytes, subchondral sclerosis and the formation of bone cysts, all of them being included in the OARSI atlas for defining HOA [49]. In addition, some of the researchers have included phenotyping based on the biomarkers for cartilage, bone and synovial turnover [50,51] in their studies.
The data review from the systematic reviews and meta-analyses on the effect of different IA-therapies in HOA, found the presence of great variability in the reported results, regarding the ES and the ED, which is quite remarkable even in the high-quality studies included in the official OARSI [16] and ACR [17] guidelines for HOA management. This variability suggests the presence of persistent in homogeneity of the selected patient groups, based on a certain parameter, or a difference in the effects of the drugs used, depending on the type of methodology used for the guidance of the arthrocentesis (ultrasound vs. fluoroscopy with a contrast). In previously published systematic reviews [22,28], we identified and analysed the designs of 20 studies on IA-CS/HOA and 29 studies on IA-HA/HOA. In neither of the 49 study designs, homogenisation of the patient groups based on the indicator ‘RP’ with a proper gender distribution (GD) according to the RG and RPs of patients, was present. The need for a fixed GD in patient groups is based on the well-known gender-related differences in CPs, mJSW, BMD, levels of bone and cartilage turnover markers between womеn and men of the same age, the same BMI, and the same RG/RPs [52-61]. In addition, we found that ES and ED of the different drugs was dependent on the methodology of arthrocentesis guiding. We hypothesized that the missing indicator ‘RPs’ with a proper GD of the patient groups and the different guidance of the arthrocentesis were the reasons for the variability in the results regarding the efficacy of the different types of IA-treatment in HOA. This suggestion was tested by creating a clinical trial with an appropriate design.
The aim of the current study was to assess the relation between the indicator ‘RP’ and the values of CP’s; LP’s and RI’s of patients with HOA and to obtain reliable results regarding the response of the different RPs of HOA to the different types of IA-treatment by ensuring proper homogenization of patient groups prior to the initiation of the study.
Our study is a single-center, randomised, double-blinded, and controlled study (DBRCT) that was conducted over an 8-year period (2014-2022) at the outpatient unit of the rheumatology department. Each patient signed an informed consent form,approved by the Ethics Committee of“Pulmed” University Hospital - order № PVII/ 28.06.2011. The studywas approved and registered in advance at the Regional Health Inspectorate under the section “Radiation Control” with No. XI-214/06.07.2011and finally by the Bulgarian Drug Agency withNo. KИ-109-3-0008/12.01.2014.
The study included 400 participants in three groups (IA-NS as a control group, N = 150; IA-CS, N = 100; IA-MMW-HA, N = 150). Each group consisted of an equal number of patients divided into two RGs according to the Kellgren-Lawrence system (K/L-II and K/L-III), further divided into three subgroups of 25 patients from the different RPs (‘A’, ‘I’, ‘H’) with a fixed GD (F /M ratio = 15 /10 in each subgroup). The group of IA-CS did not include patients with ‘A’-RPs in both radiological grades due to the known negative effect of IA-CS in ‘A’-RP of HOA. Patients from all treatment groups wereallowed to use a simple analgesic - Paracetamol- up to 2.0 g/24 h (Paracetamol tablets 500 mg, Zentiva, UK) in combination with a proton pump inhibitor - Pantoprazole 40 mg/24 h (Nolpaza tablets 40 mg, KRKA, Slovenia) [which were supplied by the study team and the used medications were assessed by the pill count during each visit] andphysical exercise. This treatment protocol (simple analgesics plus exercise therapy) was accepted as a ‘standard of care’ and was approved by both ethic committees (regional Ethics Committee of the University Hospital “Pulmed”; central Clinical Trials Ethics Committee of the Bulgarian Drug Agency).
The following IA - medications were used: Depo Medrol ® - methylprednisolone acetate 80 mg/2 ml, manufactured by - Pfizer Inc. Distributed by -Pharmacia & Upjohn Company LLC, division of Pfizer Inc. New York, NY 10017; Euflexxa ® -MMW-HA, 20 mg/2 ml, molecular weight 2.4-3.6 MD, manufactured by -Bio-Technology General (Israel) Ltd. Be'er Tuvia, Kiryat Malachi 83104, Israel. Distributed by FERRING PHARMACEUTICALS INC. PARSIPPANY, NJ 07054; Normal Saline - Pfizer Injectables Sodium Chloride (NACL) for Injection 0.9% is a sterile solution packaged in a flip top plastic vial -10 mL × 25 per tray, manufactured by - Pfizer Inc. Distributed by -Pharmacia & Upjohn Company LLC, division of Pfizer Inc. New York, NY 10017.
Inclusion and exclusion criteria:
The inclusion criteria we used were: (1) Diagnosis of primary, single or double-sided hip osteoarthritis according to the ACR criteria [62]; (2) Symptomatic hip osteoarthritis (PW by VAS ≥ 39/100 mm [63]), WOMAC-A ≥ 6/20, WOMAC-C ≥ 30/68 [64]; (3) Radiographically confirmed hip osteoarthritis (participated grades II and III according to K/L classification [65]; (4) Signed informed consent.
Exclusion criteria in our study were: (1) All cases of secondary HOA; (2) Severe deviations in the loading axes for the lower limbs; (3) Presence of an effusion (hypoechoic signals by grey scale ultrasound examination - GSUS, with changes of the normal concave shape of the joint capsule) or synovitis (synovial hypertrophy by GSUS with power Doppler signals - in joints without synovial effusion); (4) Signs of RP-HOA (rapidly progressing HOA) in ‘A’-RPs - subchondral collapse or microfractures, subchondral cysts in the femoral head; (5) Any intra-articular treatmentor additional treatment with sulfate sugars, biocollagen, hyaluronic acid, diacerein, or avocado andsoybean unsaponifiables within 6 months prior to the baseline visit; (6) Age above 70 and below 60; (7) Body mass index (BMI) less than 21 kg/m 2 or more than 28 kg/m 2 ; (8) Poorly managed diseases, including hypertension, diabetes, cardiovascular,and cerebro-vascular diseases.
Age restrictions were introduced in order to exclude: 1) Moderate or mild hip dysplasia (having clinical presentation before the age of 55 years) [66]; 2) The effect of hormonal changes in early menopause on SB -turnover (45-55 years) [53,54]; 3) The high rate of hip osteoarthritis in people over 60 years of age [1], Bulgarian data on the life expectancy (decreased chance of successfully completing the 8-year follow-up period after age 75 years). The limitation in BMI and in severe deviations of the loading axes were introduced to eliminate the effect of these factors on the radiographic progression of HOA [42,67]. The need for a fixed GD according to RGs/RPs in the patient groups has already been discussed above [52-61].
Study design: The sample size for the patient’s groups and subgroups was calculated according to the methodology described by J. Wittes [68], assuming a 2% possible annual loss of patients in the treatment groups, compared with 1% in the control group. Restricted block randomization [69] was applied after accrual of the patient cohort, resulting in the formation of the following six patient blocks: K/L - II’A’ (N = 50); K/L-II’I’ (N = 75); K/L-II’H’ (N = 75); K/L-III’A’ (N = 50); K/L-III’I’ (N = 75); and K/L-III’H’ (N = 75). Еach of them was with a fixed GD - F /M ratio = 60/40% (N = 75 - 45/30 and N = 50 -30/20). From each patient block, subgroups with a fixed GD (F /M ratio = 15/10) were randomly generated using a computer program.
Blinding: The rheumatologists performing the ultrasound-guided arthrocentesis were blinded to the randomization groups as well as to the follow-up results. The administered medication was given by the hospital pharmacist and was placed in a second syringe with a similar appearance for all the groups in advance (Figure 1). The hospital pharmacist was aware of the randomisation group and number but was blinded to the clinical, laboratory and radiological data. The radiologists performing the radiographic examinations were blinded to the design, randomization group, and clinical and laboratory data of the patients. The study coordinators (external, non-medical staff provided by the Bulgarian Drug Agency) were responsible for patient contacts (calling for the visits), know which randomized number corresponds to which patient, but were blinded to all clinical, laboratory and radiological data of the patients. Only the principal monitor (external medical staff provided by the Bulgarian Drug Agency) had access to randomization group and all CPs, LPs and RIs data, but he did not know the patients.
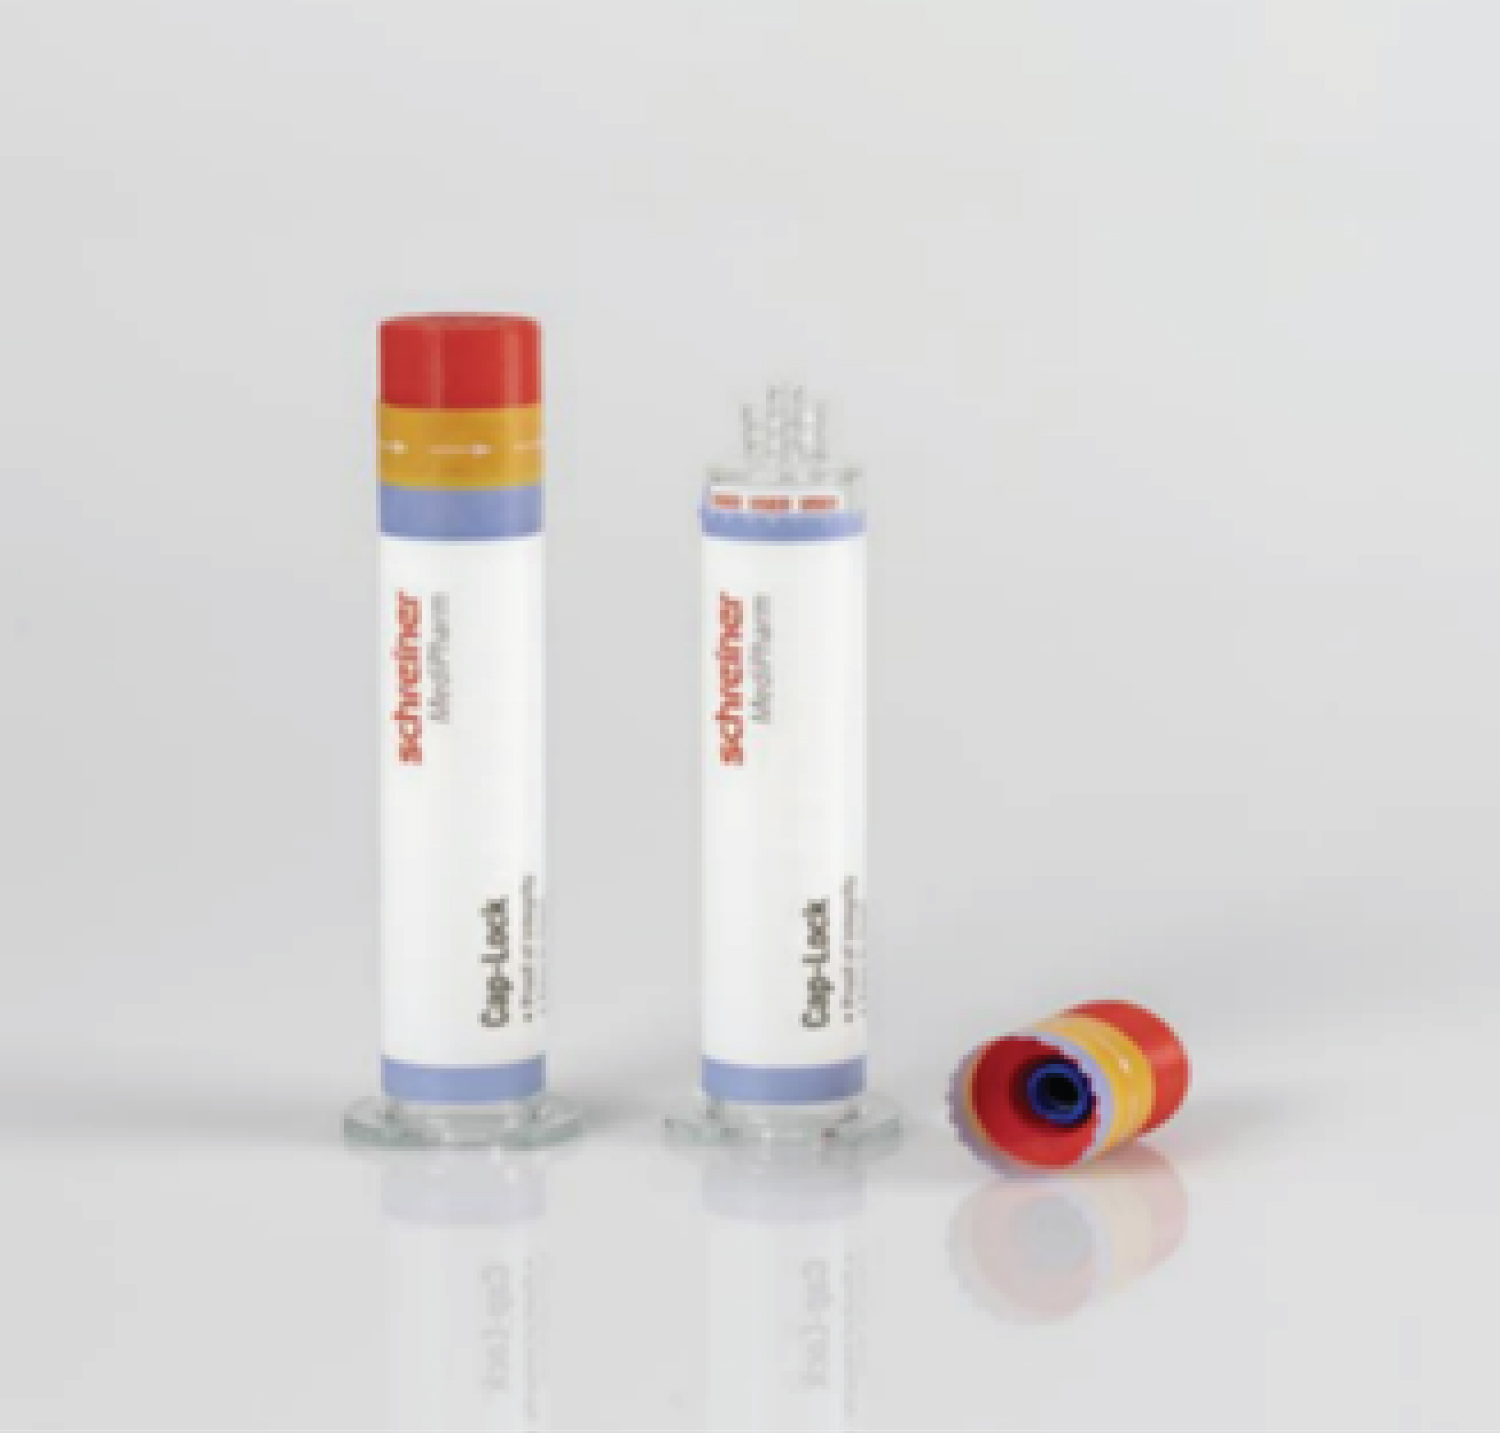 Figure 1: Blinding - the device "second syringe" in which the pharmacist puts the real one.
View Figure 1
Figure 1: Blinding - the device "second syringe" in which the pharmacist puts the real one.
View Figure 1
Physical examination: Patient physical examinations and clinical data recording were performed by a board-certified rheumatologist. At each patient visit, the following indicators were assessed: Vital signs (heart rate and rhythm, arterial blood pressure, body temperature), height, weight (BMI), pain at walking (PW by VAS-100 mm) [63], functional ability (by WOMAC-C) [64], the presence of adverse events, and the quality of life (by SF-36 and PtGA) [70]. Responses to treatment by using the OMERACT-OARSI set of responders’ criteria [71] and minimal clinically important improvement (MCII) [72] were also assessed.
4.2.2. MSUS ( musculoskeletal ultrasound) examination and US-guided arthrocentesis: We used an Esaote-MyLab-6 US machine, equipped with a 3.5-12 MHz convex probe. Gray scale US (GSUS) was used to measure the distance between the femoral neck and the joint capsule in both the target and the contralateral joint (the presence of an effusion and synovitis was one of the exclusion criteria), and to assess the bone profile and the bursae adjacent to the hip joint. In all cases of detection of joint effusion or synovial hypertrophy (GSUS), the power Doppler US was used to evaluate the changes. For the US-guided arthrocentesis we used an anterior, sagittal approach, free hand technique. The indicator of a successful procedure was the change in the capsule course after the administration of 2 ml of NS/CS/HA.
Radiographic examinations: The radiographic images were taken in an upright weight-bearing position, anterior-posterior projection, with a slight (15° degrees) internal rotation of the feet provided using a “V” pad -placed 100 cm from the source, with perpendicular beams focused on 4 cm above the symphysis. The following indicators were measured and evaluated: RGs according to К/L grading scale [65]; RPs-‘A’, ‘I’ and ‘H’; JSW - measurements of each joint were performed manually using distance measurement software for digitalised radiographic images at three points: Superomedial, apical and superolateral (Figure 2). The mean of the three distances (mean joint space width - mJSW in millimeters) and the annual velocity of joint space narrowing -JSN mm/yearly (JSN0 = mJSW-M0 - mJSW-M12) were used for the statistical analyses, according to the recommendations of the Barcelona Consensus Group [57].
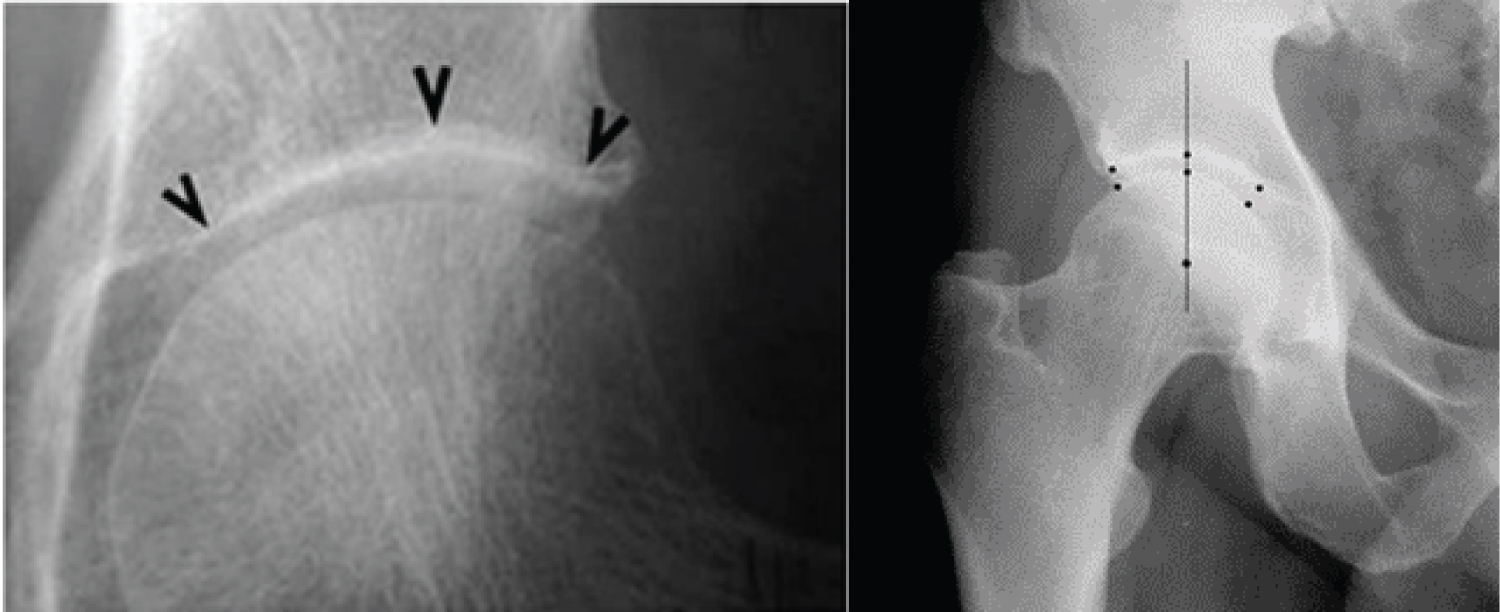 Figure 2: Measurement of mJSW as the mean of the three distances according to the Barcelona Consensus (left image) [57] and in a patient from our study (right image).
View Figure 2
Figure 2: Measurement of mJSW as the mean of the three distances according to the Barcelona Consensus (left image) [57] and in a patient from our study (right image).
View Figure 2
DXA measurements were performed by using the Lunar Prodigy Primo-en CORE machine, version 17- according to the methodology recommended by the ISCD [58]. The following indicators were assessed: proximal femur - BMD, lumbar spine - BMD, total body - BMD (PF - BMD; LS - BMD; TB - BMD); hip axis length (HAL); neck shaft angle (NSA) and minimal neck width (MNW). The measurements and interpretation of the results from the radiographic and DXA investigations were conducted by two separate certified by ISCD radiologists, who were blinded to the design and clinical and laboratory data, and with a very good inter-reader reliability (intraclass correlation coefficient ICC of 0.918, 95% CI: 0.846-0.960) and PABAK (prevalence-adjusted and bias-adjusted kappa) values for X-ray/DXA reading of 0.860 and 0.880, respectively.
Biochemical analyses: The biochemical analyses were performed and interpreted at the certified laboratory of the University Hospital ‘Pulmed’ in Plovdiv, Bulgaria. Тhe serum levels of several markers were assessed, including:
Safety tests - blood count, blood sugar, liver (aspartate - aminotransferase - As At, total bilirubin) and kidney (BUN, serum creatinine) function tests.
sCTX - I (serum β - beta-isomerized carboxy-terminal cross-linking telopeptide of type I collagen also known as - β - Cross Laps), a breakdown product of type I collagen by osteoclasts, comprising 90% of the organic bone matrix, a generally accepted marker of bone resorption (used by us as a marker of bone turnover) [53,54], methodology CLIA - reference range: Men (> 60-years-old) < 0.7 ng/mL; women > 60-years-old (postmenopausal) < 0.9 ng/mL).
uCTX-II (urine C-terminal crosslinking telopeptides of collagen type II (CTX-II) - a generally accepted marker of cartilage turnover [55,56] (competitive ELISA, Cartilaps, IDS, Boldon, UK, (reference range 129 and 345 ng/mmol Cr), with intra- and inter-assay CVs below 8% and 10%, respectively). The concentration of CTX-II (ng/L) was standardised to the total urine creatinine (mmol/L), and the units for the corrected urine CTX-II concentration were ng/mmol creatinine (Cr) [55].
Quantitative detection of urine creatinine levels was performed by a Human Creatinine ELISA Kit, Chongqing Biospes Co., Ltd. (Catalog No: BYEK2883). The corrected uCTX-II concentration relative to urinary creatinine clearance was calculated according to the formula: corrected uCTX-II (ng/mmol) = 1000 × uCTX-II (ug/L)/urinary creatinine (mmol/L) [55].
Follow-up: The following indicators for the patients in the three groups were assessed: radiographic (RIs - JSW/JSN; BMD - DXA); clinical (CPs - pain at walking by visual analogue scale PW-VAS; functional ability -F by WOMAC-C; atient global assessment - PtGA and quality of life by - SF-36); and also the time to conversion to THR (tTHR); laboratory (LPs - safety tests and levels of bone and cartilage turnover markers). RIs were assessed every 12 months, whereas CPs and LPs were assessed every month until M6, every 3 months until M12 and every 6 months until M96. Ultrasound examination was performed at the screening visit, and during the first (M0) and second (M5) treatment course, after that - only if indicated (in case of adverse events - AEs).
Early termination, caused by paracetamol inefficacy ≤ 2.0 g/24h with pain and functional limitation with a referral to total hip replacement, was not registered as an AE/lost to follow-up (LFU), but was considered a part of the natural evolution of the HOA.
Statistical analyses: All data were analyzed by using the Statistical Package for the Social Sciences (SPSS) version 21. All obtained results were presented as numbers and percentages (%) for qualitative variables and as medians with interquartile ranges (IQR) for continuous variables. Non-parametric Mann-Whitney and Kruskal-Wallis tests were used to detect statistically significant differences (SSD) - as interim analyses. When SSD was present, post-hoc Dunn - Bonferroni multiple comparisons were performed as final analyses for statistical significance. Pearson's correlation analysis, Kendall's rank correlation, and multiple linear regression were used to analyze the effects of RPs/RGs and the different IA -therapies on radiographic progression. All statistical tests were two-tailed and conducted at a significance level (α) of 0.05 and a power of 80%. Exact p-values were used to analyze and interpret the results, with p < 0.05 denoting a statistically significant change.
Due to the restrictions imposed by the study design (minimizing the influence of the factors age, DD and BMI over HOA progression) and the proper homogenisation of the groups based on RG/RP with a fixed GD, the patient groups were homogenous with a maximum standard deviation of 1.7 - for all assessed parameters. There were no significant differences in the values of the clinical, laboratory, and radiographic parameters at baseline between the three groups in all three patterns (Table 1).
Table 1: Baseline characteristics of the three groups. View Table 1
All ‘А’-patterns from both radiographic grades of the three treatment groups had decreased BMD at all measurement sites (PF - BMD; LS - BMD; TB - BMD) and 70% were with osteoporosis according to ISCD criteria [58]. On the other hand, all ‘I’-patterns were with normal (‘I’) and all ‘Н’-patterns with slightly increased local BMD (p < 0.05) in comparison with controls without HOA (Table 1 and Figure 3).
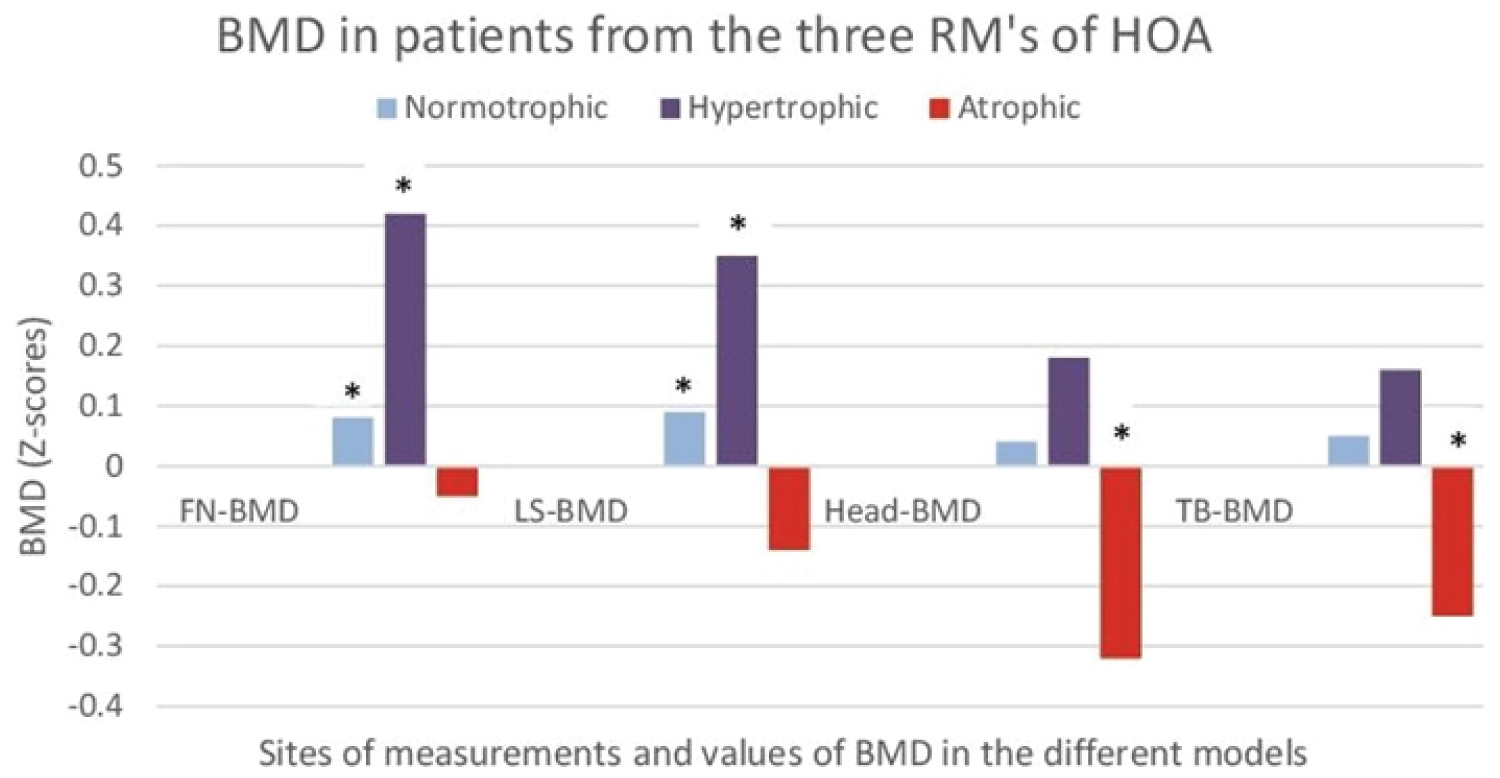 Figure 3: Bone mineral density (BMD) in patients of the three radiographic patterns (RPs) of hip osteoarthritis (atrophic, normotrophic, hypertrophic). The results are shown as Z scores of FN-BMD (femoral neck), LS-BMD (lumbar spine), Head-BMD (cranium), and TB-BMD (total body) for each radiographic pattern. Z-scores allowed comparisons with standardized (gender, age, BMI) controls without hip osteoarthritis; *- a statistically significant differences (p < 0.05) in comparisons with controls without hip osteoarthritis.
View Figure 3
Figure 3: Bone mineral density (BMD) in patients of the three radiographic patterns (RPs) of hip osteoarthritis (atrophic, normotrophic, hypertrophic). The results are shown as Z scores of FN-BMD (femoral neck), LS-BMD (lumbar spine), Head-BMD (cranium), and TB-BMD (total body) for each radiographic pattern. Z-scores allowed comparisons with standardized (gender, age, BMI) controls without hip osteoarthritis; *- a statistically significant differences (p < 0.05) in comparisons with controls without hip osteoarthritis.
View Figure 3
Regarding the levels of bone and cartilage turnover markers - all "A"-patterns had increased levels as compared to "I"-patterns and the latter had increased levels as compared to "H"-patterns (p < 0.05) (Table 1 and Figure 4).
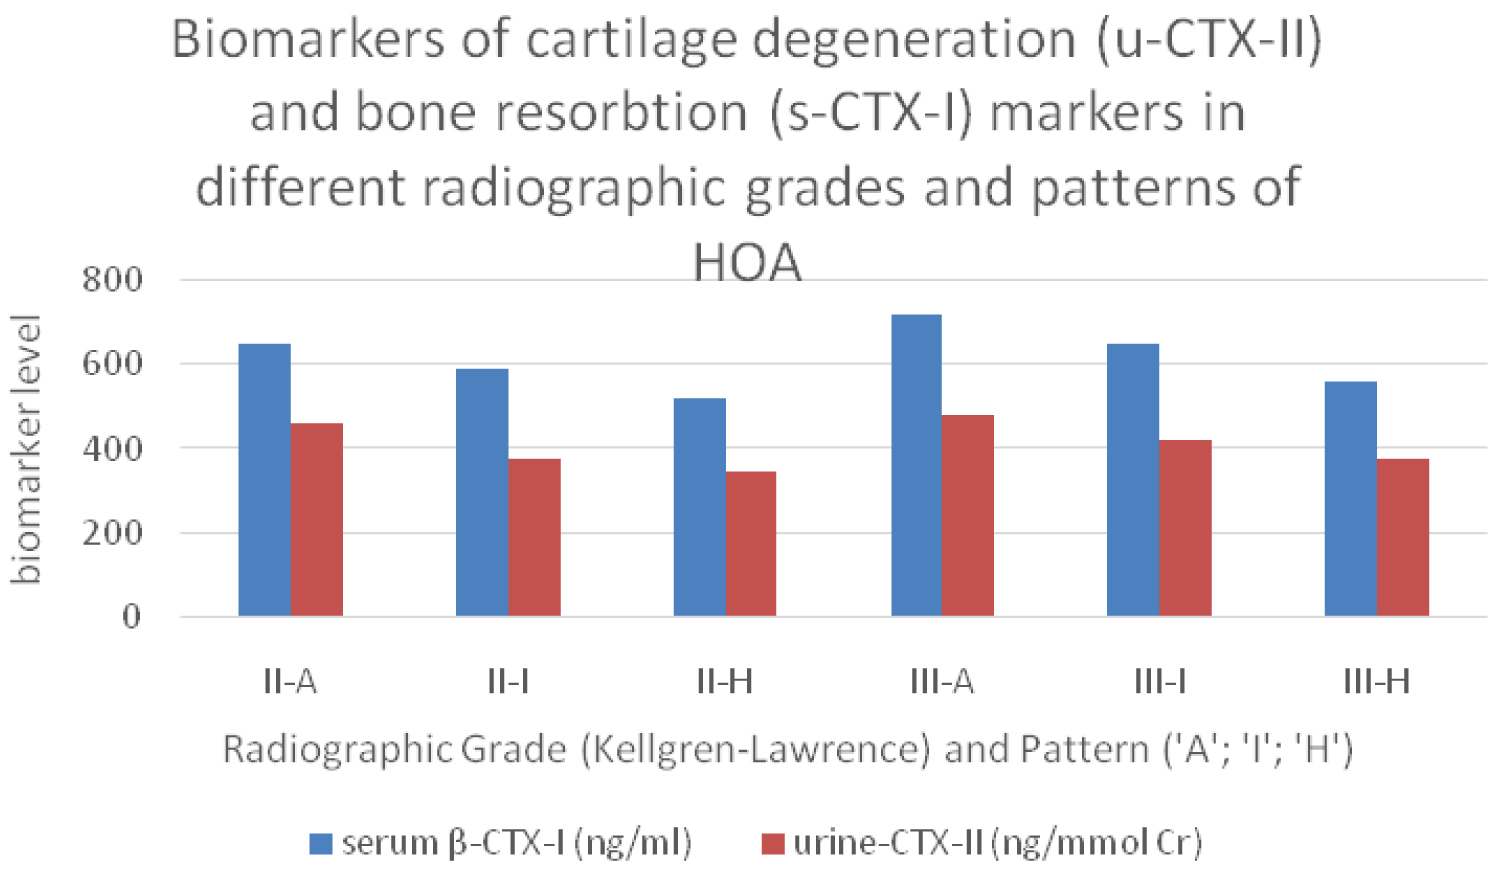 Figure 4: Markers for bone (serum β-CTX-I) and cartilage (urine CTX-II) turnover from different radiographic grades and patterns of hip osteoarthritis; II/III -radiographic grades according to Kellgren-Lawrence; ‘A’; ‘I’; ‘H’ - radiographic patterns (atrophic/normotrophic/hypertrophic).
View Figure 4
Figure 4: Markers for bone (serum β-CTX-I) and cartilage (urine CTX-II) turnover from different radiographic grades and patterns of hip osteoarthritis; II/III -radiographic grades according to Kellgren-Lawrence; ‘A’; ‘I’; ‘H’ - radiographic patterns (atrophic/normotrophic/hypertrophic).
View Figure 4
Within group comparisons: The comparison between ‘H’-RPs and ‘A’-RPs showed statistically significant differences (SSD) in all CPs (p < 0.001), the levels of cartilage and bone turnover markers (p < 0.01), BMD (p < 0.001) and indicators of bone geometry - increased MNW (minimal neck width, p < 0.001), and no significant differences in mJSW. The comparisons of ‘H’ vs. ‘I’ and of ‘I’ vs. ‘A’ showed differences, but they were not statistically significant (p > 0.05), even at the interim analyses (Table 2).
Table 2: Within-group comparisons (‘H’ vs. ‘I’ vs. ‘A’) of the values of cps, ris, and cartilage and bone turnover markers in both groups. The IA-CS group was excluded from the comparisons due to the absence of 'A'-patterns. View Table 2
Significance of the ‘gender’ indicator and ‘gender distribution’ in the patient groups: The influence of gender on the values of clinical, laboratory and X - ray parameters is shown in Table 3. The disease duration (DD) was different in the different RGs and RPs but also between women and men of the same RG/RP. Men and women of the same RG/RP had SSD in median values of all CPs, LPs and BMD at all measurement sites (PF - BMD; LS - BMD; TB - BMD). On the other hand, men and women with similar CP values had SSD in mJSW (Table 4). The result in this section clearly demonstrates the need to fix the gender distribution with the radiographic stage and pattern in the process of homogenisation of the patient groups in the studies on hip osteoarthritis.
Table 3: Correlation coefficients of Kendall's tau-b between the clinical, laboratory and radiographic parameters of the different radiological patterns. View Table 3
Table 4: Significance of the indicator ‘gender’, for the values of clinical, laboratory and radiographic parameters in patients with hip osteoarthritis. View Table 4
Correlations between clinical, laboratory and radiographic parameters in the different radiological patterns : Because of the restrictions imposed by the study design (minimizing the influence of the factors age, DD and BMI over clinical presentation and progression of HOA) and the proper homogenisation of the patient groups according to the RG/RP’s with fixed GD - all CPs/ RIs and levels of cartilage turnover marker (uCTX-II) in the three patient groups showed a high correlation (rS > 0.7). The correlations between the different CPs and between CPs/uCTX-II levels were positive, while between the CPs and the degree of radiographic changes were negative. The correlation between mJSW and CPs was almost equal as compared to that of K/L grade and CPs (rS = 0.75/rS = 0.85), considering the fact that the correlation between the two parameters mJSW/K-L grade was 0.745. The strongest correlation was between WP/WOMAC-C - 0.980; and the weakest one - between mJSW/WOMAC-C - 0.733. Moreover, the correlations between the same parameters were with different strength for the different patterns (Table 3).
During the follow-up, four types of results were analysed: 1) The differences within each treatment group between the different RPs of the same RG - to evaluate the natural (NS group) and the treatment modified (IA-CS; MMW-HA groups) evolution of the different RPs. 2) The differences between the treatment groups - to assess the efficacy of the different IA therapies over the evolution of the different RPs of HOA. 3) The absolute and relative (percentage) differences in each group between the baseline values and the values during the different time points throughout the follow-up - to assess for MCII/OARSI responses of the different IA therapies. 4) Side effects - from the procedure itself or from the administered drugs by comparison between the patients from the different groups, with a different RG/RPs of HOA.
Serious adverse events (SAE) - For a period of 5 years the following SAEs were registered in 400 patients: 1) Death - in one patient - a 72-year-old man with acute myocardial infarction, 5 th year of follow-up (M54), NS group. 2) Bleeding from the upper gastrointestinal tract, managed with endoscopic hemostasis - in a 69-year-old woman, 5 th year of follow-up (M60), CS group; 3) Fracture of the femoral neck after a fall was the reason for a premature conversion to THR in a 70-year-old woman, 5 th year of follow-up (M56), MMW-HA group. The decision of the Local and the Central Ethics Committee was the same - without any relationship with the study because the event occurred more than 4 years after the therapeutic procedures, and the only oral medications were paracetamol up to 2.0 g/24h and a proton pump inhibitor - pantoprazole 40 mg/24h. The above-mentioned 3 patients were considered as LFU and were not included in the statistical analyses. The number of dropped out patients was less than the expected in the calculation of the group sample size and does not interfere with the selected power - 80% and the level of significance (α = 0.05) as well as the obtained results.
Other AE ’ s - the rate and type of the observed AEs after the second treatment course (M5) were not different as compared to the ones after the first course (M0), as well as to the published literature data [73,74]: 1) Topical reactions from the target joint - increase in pain after arthrocentesis was present in 27 out of 1400 arthrocenteses (1.9% of all arthrocenteses, and 1.8/2.0% when comparing the first with the second treatment course); 2) Systemic AEs - a transient increase in arterial blood pressure and blood sugar levels was registered in IA-CS group - 12/100 (12%) in patients with a prior history of concomitant metabolic syndrome and arterial hypertension. Flush of the face and the neckline occurred in 6/100 patients (6%), which occurred again during the second treatment course.
For the observation time, loss of entire subgroups was recorded as follows :
M 36-38 - NS-III’A’; M 48-50 - NS /DM-III’I’ and Eu - III’A’; M 60-62 - NS /DM-III’H’, Eu - III’I’ and NS-II’A’; M 72-74 - NS /DM-II’I’ and Eu - III’H’; M 78-80 - NS /DM-II’H’ and Eu - II’A’; M 84-86 - Eu - II’I’ (Figure 5). This was an expected outcome of hip osteoarthritis disease progression and not a loss of subjects - final clinical and radiographic measurements were completed, with a clear pathway for patients to elective THR with options for follow-up as needed.
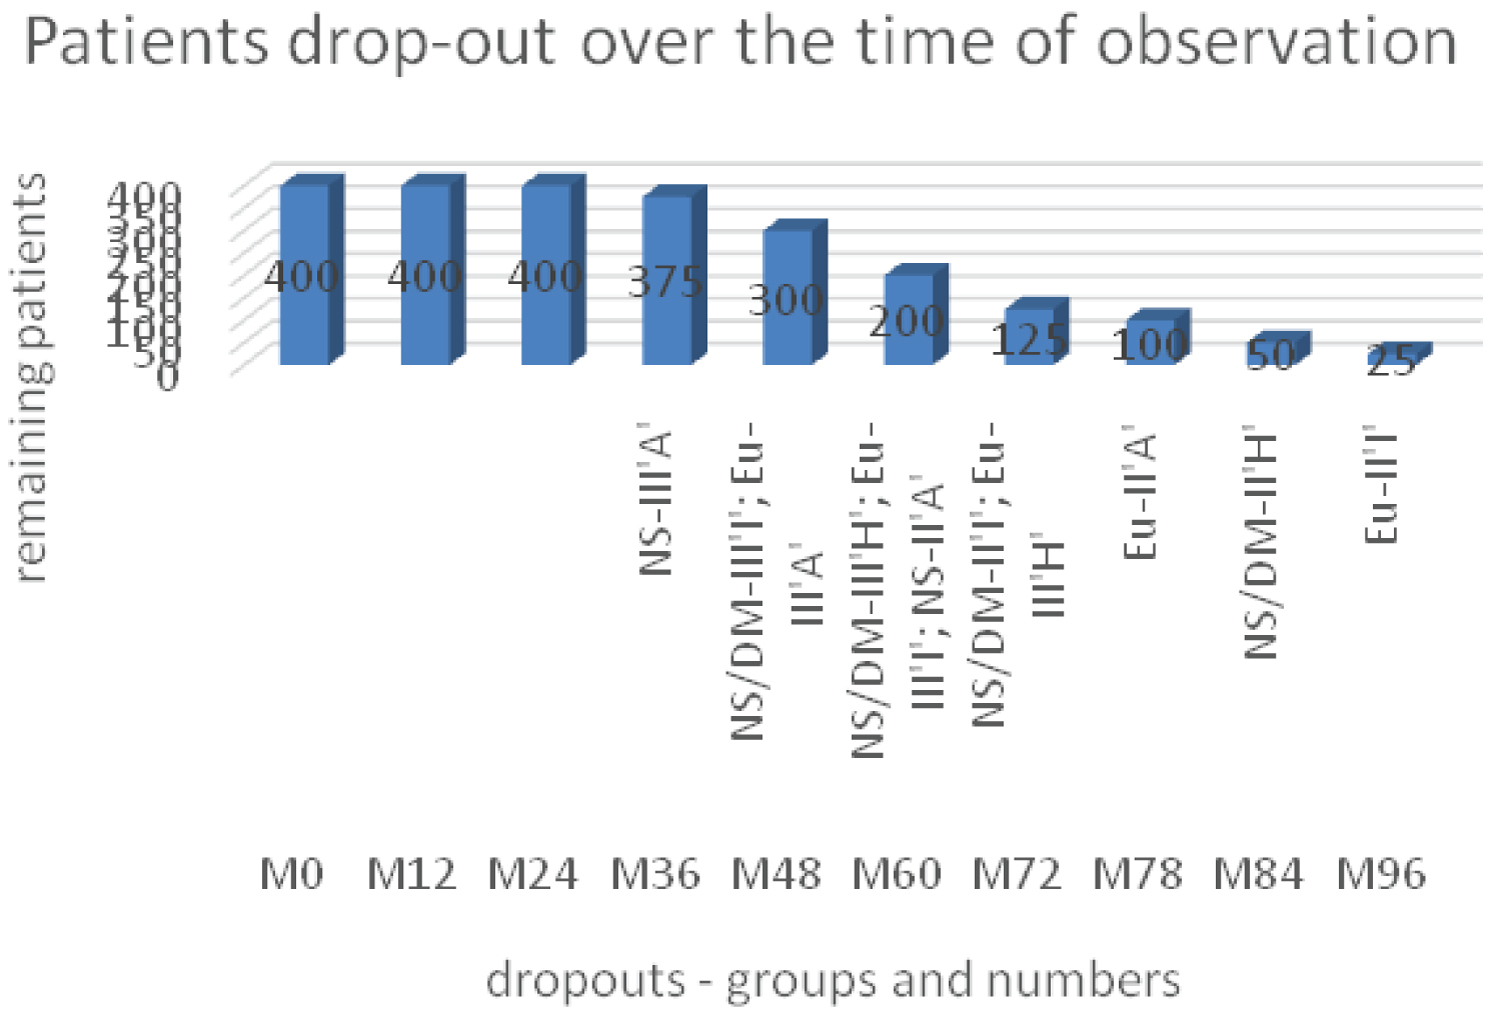 Figure 5: Follow-up data. NS - control group; DM - IA - CS group; Eu -MMW-HA group; III/II -radiographic grades according to Kellgren-Lawrence; ‘A’; ‘I’; ‘H’ - atrophic, normotrophic, hypertrophic patterns.
View Figure 5
Figure 5: Follow-up data. NS - control group; DM - IA - CS group; Eu -MMW-HA group; III/II -radiographic grades according to Kellgren-Lawrence; ‘A’; ‘I’; ‘H’ - atrophic, normotrophic, hypertrophic patterns.
View Figure 5
Changes in the CPs and RIs over time and under the different treatments are presented in Table 5. The M36 time point is pivotal in all comparisons, due to its presence in all three RPs of both RGs for all treatment groups, and the emergence of the key differences in JSN; mJSW; BMD between individual RPs at this time.
Table 5: Changes in clinical and radiographic parameters over time. View Table 5
Changes in uCTX-II levels over time for the different radiographic grades and patterns, under the different treatments are presented in Figure 6A and Figure 6B.
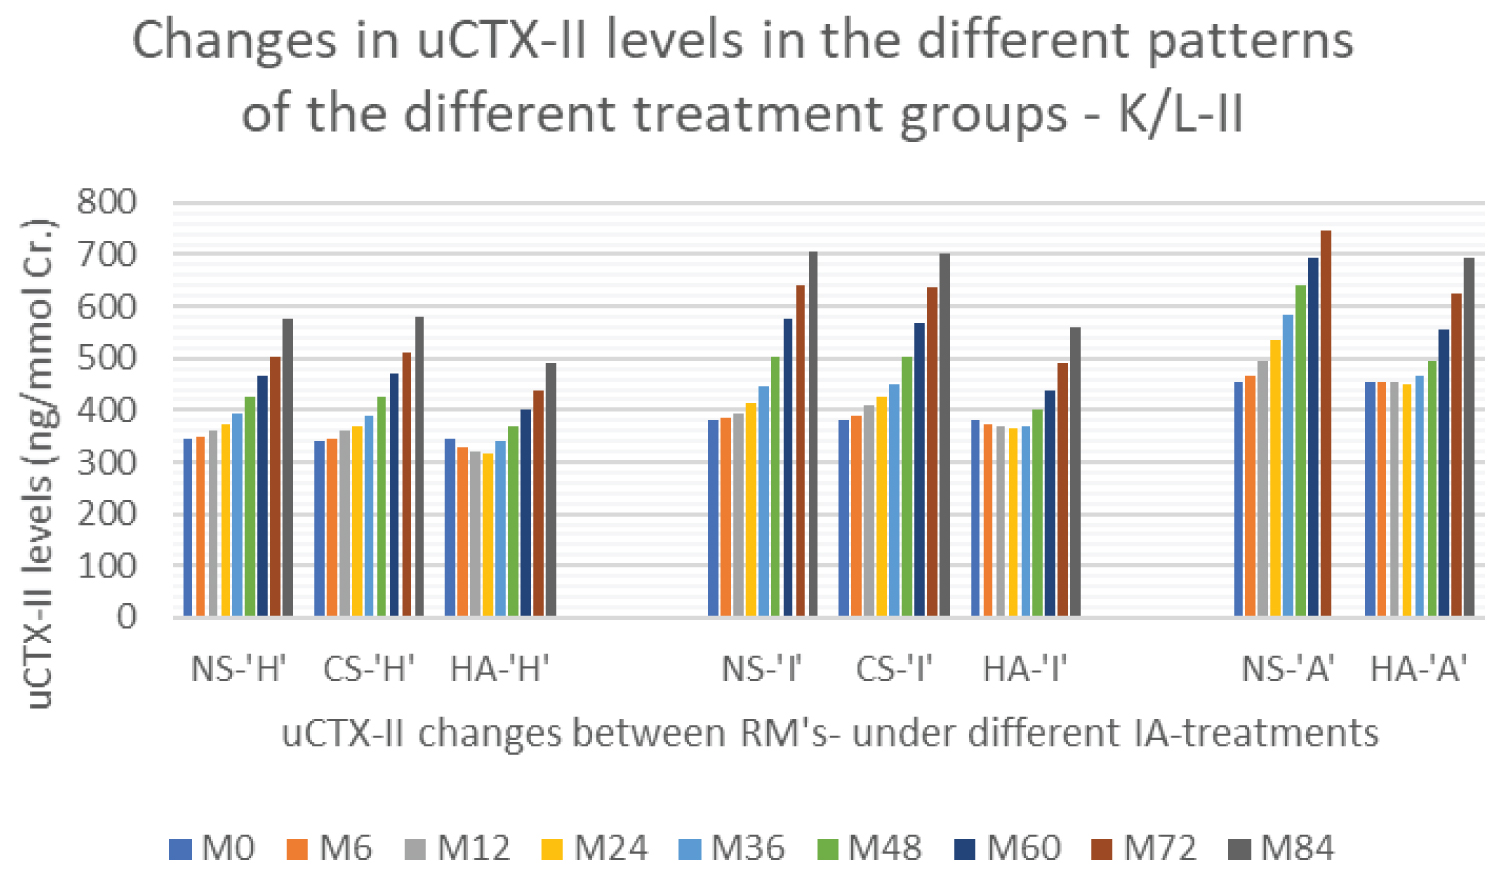 Figure 6a: Time changes of uCTX - II levels for the different radiographic grades and patterns, under the different treatments. NS - control group; CS - IA-CS group; HA - IA-MMW-HA group; ‘H’; ‘I’; ‘A’ -hypertrophic, normotrophic, atrophic patterns. Changes in K/L - II stage.
View Figure 6a
Figure 6a: Time changes of uCTX - II levels for the different radiographic grades and patterns, under the different treatments. NS - control group; CS - IA-CS group; HA - IA-MMW-HA group; ‘H’; ‘I’; ‘A’ -hypertrophic, normotrophic, atrophic patterns. Changes in K/L - II stage.
View Figure 6a
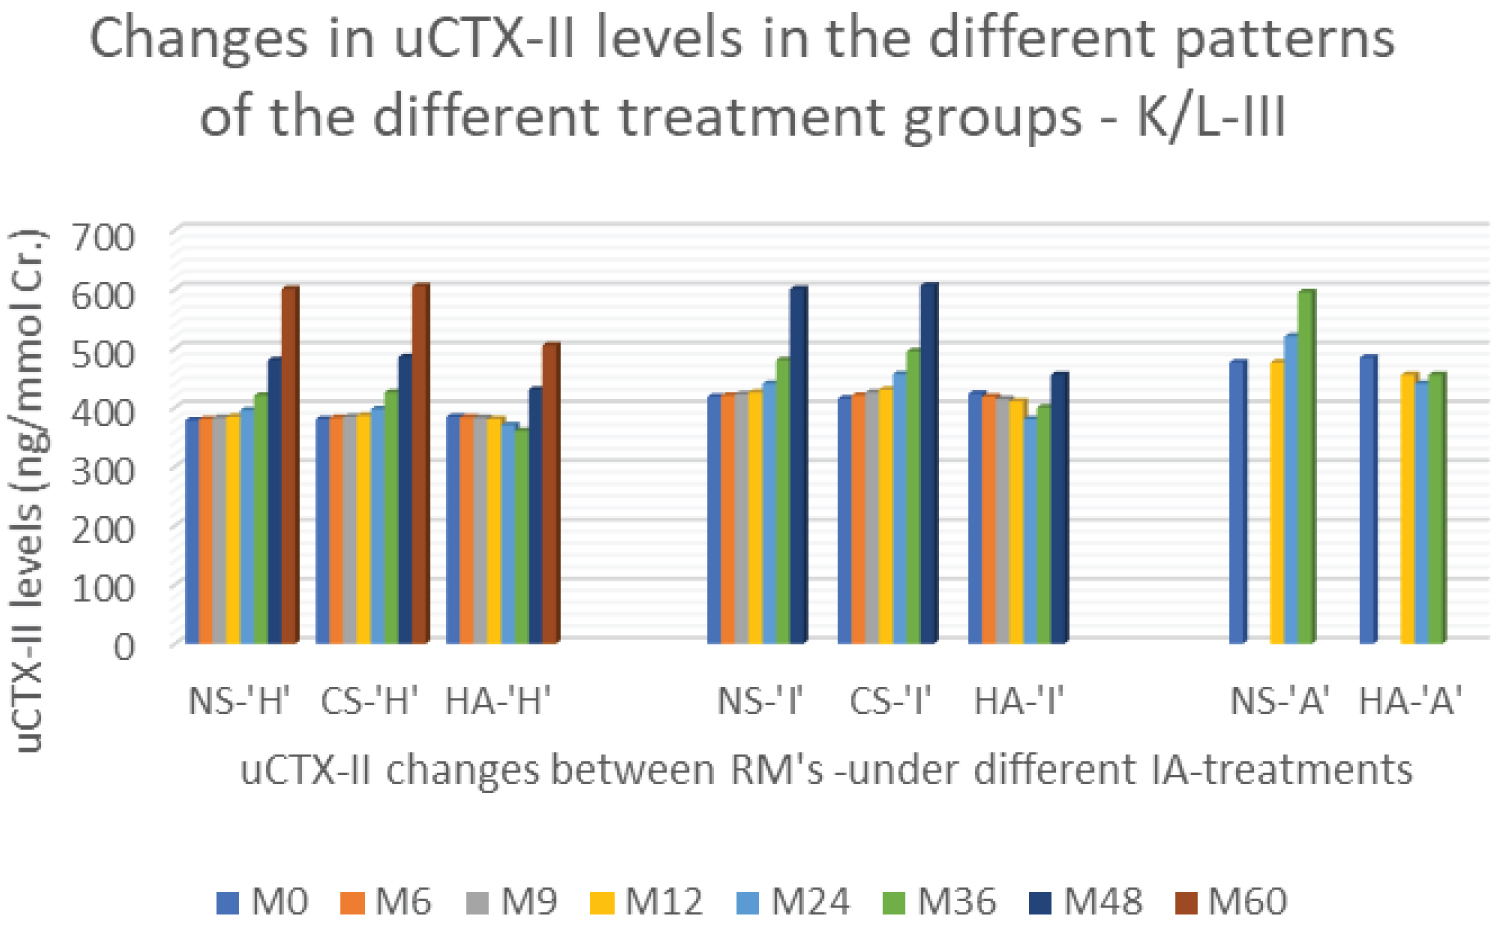 Figure 6b: Time changes of uCTX - II levels for the different radiographic grades and patterns, under the different treatments. NS - control group; CS - IA-CS group; HA - IA - MMW - HA group; ‘H’; ‘I’; ‘A’ -hypertrophic, normotrophic, atrophic patterns. Changes in K/L-III stage.
View Figure 6b
Figure 6b: Time changes of uCTX - II levels for the different radiographic grades and patterns, under the different treatments. NS - control group; CS - IA-CS group; HA - IA - MMW - HA group; ‘H’; ‘I’; ‘A’ -hypertrophic, normotrophic, atrophic patterns. Changes in K/L-III stage.
View Figure 6b
Changes in BMD parameters over time between different RPs of both RGs - for NS group (closest to the natural evolution of HOA) are presented in Figure 7.
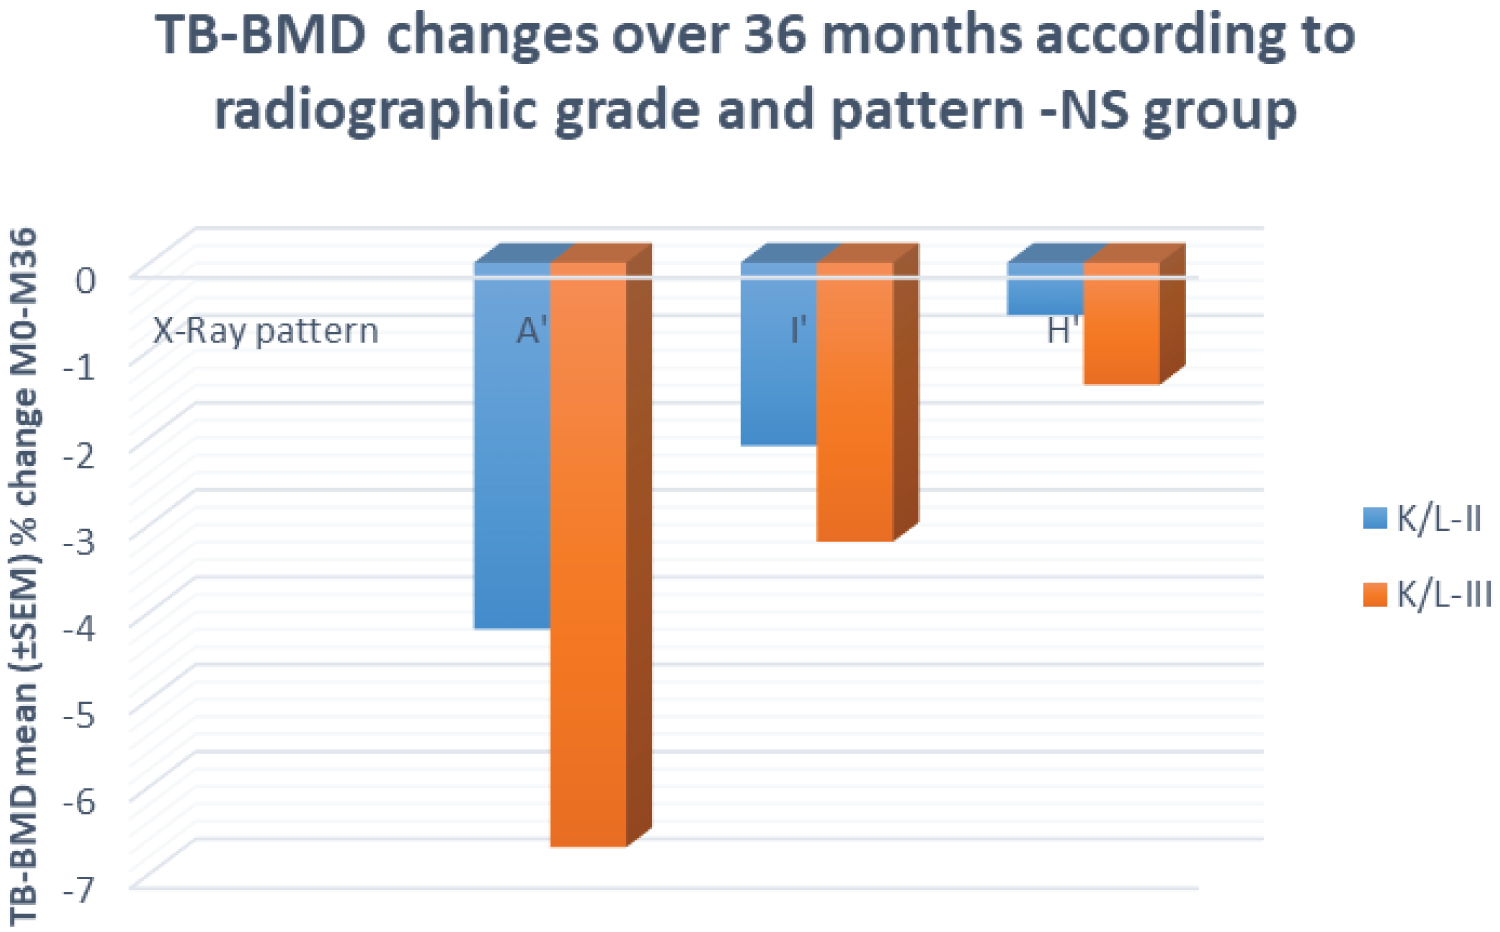 Figure 7: Changes in BMD (TB-BMD) in NS (control group) for different RPs of both RGs over 36 months. The levels are presented as standard error of the mean (SEM) percentage changes; K/L-II/III -radiographic grades according to Kellgren - Lawrence; ‘H’; ‘I’; ‘A’ - radiographic pattern (hypertrophic/normotrophic/atrophic).
View Figure 7
Figure 7: Changes in BMD (TB-BMD) in NS (control group) for different RPs of both RGs over 36 months. The levels are presented as standard error of the mean (SEM) percentage changes; K/L-II/III -radiographic grades according to Kellgren - Lawrence; ‘H’; ‘I’; ‘A’ - radiographic pattern (hypertrophic/normotrophic/atrophic).
View Figure 7
Within-group comparisons: At baseline in all treatment groups (NS/CS/HA), significant differences existed only between the endmost RPs (‘H’ vs. ‘A’) in CPs, LPs and BMD, without SSDs in mJSW, including the end RPs. During the observation period, SSDs in all CPs /LPs and RIs, were observed between all patterns (‘H’ vs. ‘I’ vs. ‘A’), in all treatment groups. These SSDs were detected at different time points during the follow-up depending on the type of treatment (Table 6). All the above mentioneddifferences in clinical, laboratory and radiographic parameters persisted until the patient dropped out from the study (as a result of THR/AE’s) or until the end of the study -M96.
Table 6: Within group comparisons - time points for the appearance of statistically significant differences in clinical (PW-VAS; WOMAC-C), laboratory (sCTX-I; uCTX-II) and radiographic (BMD; JSN; mJSW) indicators between different patterns of the same radiographic grade under the different intra-articular treatment. View Table 6
We used multiple linear regression (MLR) to determine the significance of the independent variables - radiographic grade and radiographic pattern in predicting the dependent variable - the radiographic progression of HOA (defined by changes in JSN/mJSW) at time points M12; M24; M36 (Table 7).
Table 7: Multiple linear regression - assessment of changes in radiographic progression (mJSW) depending on the RG and RPs. View Table 7
From multivariable regression in which only the RG is included, it is clearly seen that the inclusion of RP in addition to the RG, the regression equation leads to improvement of the regression (adjusted R2 increases and the standard deviation of the proportionally parameter of RG - decreases). Thus (MLR), the dependence of radiographic progression on both factors - RG and RP was proven. It is clearly visible that in a fixed moment of time (i.e. M12), RG is a factor with a greater influence than RP, but the significance of RP increases with observation time (M12 à M36), especially bearing in mind the multiplication of ‘meaning of RP’ at each of the transitions (‘H’ vs. ‘I’ vs. ‘A’). This time-increasing influence of the 'RP' indicator on radiographic progression underlies the time-observed differences in clinical, laboratory and radiographic indicators between different radiographic patterns (mentioned above).
Between - groups comparisons: We found significant differences (p < 0.001) in the values of the CPs as compared to the BL values (OARSI-responses) after one course, as follows: IA-CS - both radiological patterns of K/L-IIand the ‘H’-pattern of K/L-III, reach OARSI-responses at M1 and responses remained until M3 (K/L-III’H’) and until M5 (K/L-II’H’/’I’). Regarding the MMW-HA, after the single course, OARSI response was achieved at M2 by all radiographic patterns except for K/L-III ‘A’ and responses remained until M5. OARSI criteria were reached for MMW-HA-III ‘A’-pattern at M3 just for 1 month (M3-M4) (Table 6 and Table 8). The second course led to effect cumulation (for all treatment groups) with an increase in ES and in the duration of the registered OARSI-responses (p < 0.001) - IA-CS: K/L - III’H’ up to 3 - months vs. first course, MMW-HA -K/L - III’A’ up to 6 months vs. first course (Table 5 and Table 9). In addition, OARSI responses were registered in 'I'-pattern of K/L - III (IA-CS), lasting up to 3 months (M6 - M9) and III'A'-RPs of MMW - HA, lasting up to 6 months (M6-M12).
Table 8: Between-groups comparisons - time points for the detection of statistical differences in radiographic (JSN; mJSW) indicators between different patterns of the same radiographic grade in different treatment groups. View Table 8
Table 9: Between groups comparisons - times of onset and duration of OMERACT-OARSI responses, in the treatment groups in relation to the radiographic grade and patterns, and number of therapeutic courses. View Table 9
Statistically significant differences were found in JSN - for MMW-HA vs. NS (p < 0.001) at М12 - in the three RPs of both radiographic grades. These differences coexisted with analogous ones in mJSW, but with a later appearance at M36 and persisted at all follow-up visits until the end of the study. These results are important because they suggest the presence of a difference in the radiographic progression and therefore the presence ofa disease-modifying effect (DME) of the respective treatment modality, in addition to the pure symptomatic effect. Similar differences in the radiographic progression were also found between MMW - HA vs. IA - CS (JSN - M12, p < 0.05; mJSW-M36, p < 0.005). The difference in JSN/mJSW for the comparisons IA-CS vs. IA-NS was not significant (p > 0.1) at any time interval or in any of the RG’s/RP’s - Table 8.
Statistically significant differences (p < 0.001; for more than 12 months) were observed in the length of time to conversion to THR between NS and MMW-HA groups - for all RPs (‘A’; ‘I’; ‘H’) of the two radiographic grades (K/L -II/III). At the same time, the same difference between NS and CS group was small and insignificant (p > 0.2) (Table 10).
Table 10: Between-group comparisons (NS vs. CS vs. HA) regarding the length of time to conversion to THR. View Table 10
Analyses of the drop-out patients showed two types of differences :
Differences along the horizontal line represent the differences between the same RP in the different intra-articular treatments (between-group differences). Time to conversion to THR was different between treatment groups, but the differences between the NS and CS groups were insignificant (p = 1.0), compared to the differences between the NS and MMW-HA groups and the MMW - HA vs. CS groups, respectively, which were statistically significant (p < 0.001) for all radiographic patterns in both radiological grades.
Differences on the vertical line present differences between RPs from the same RG, on the same intraarticular treatment (within group differences). In the stage K/L - III - vertical differences 'A' vs. 'I' vs. 'H' - averaged x 12 months in all groups (NS, CS, HA). In stage K/L - II, however - while for NS/DM groups the differences remained on average x 12 months, for MMW-HA the differences were respectively 18 (‘A’ vs. ‘I’) and 24 months (‘I’ vs. ‘H’), conveying the impression that HA has a more pronounced effect on 'H' followed by 'I' and weakest on 'A' patterns.
However, if we consider the natural evolution of RPs (much slower in ’H’-RPs, followed by ‘I’-RPs and the fastest in ‘A’-RPs) and time to occurrence of SSD in CPs and RIs between the RPs of the same RG under different IA - therapies (between groups differences -discussed above), IA-HA compared to IA-CS/IA-NS, showed greatest benefits in ‘A’ followed by ‘I’ and ‘H’ - RPs.
Our study is the first to evaluate the differences in CPs, LPs, RIs and radiographic progression between different RPs of HOA, as well as the therapeutic efficacy of common IA treatments for HOA, ensuring proper homogenization of patient groups according to age, sex, BMI, radiographic grade and model - before starting the study.
Due to the limitations imposed by the study design and proper homogenization of the patient group, the maximum standard deviation of all evaluated parameters at baseline was low, while the correlations between CP; LP and RI in all patient groups and subgroups were strong. ‘A’-RPs showed a stronger correlation between the markers for AC -turnover and CPs/mJSW, as well as between the K/L grade/CPs and a weaker correlation between mJSW/CPs. On the contrary, the ‘H’-RPs showed a weaker correlation between the markers of AC turnover and CPs/mJSW and between K/L grade /CPs and a stronger correlation between mJSW/CPs. In other words, the importance of SB -changes for the degree of pain and functional limitations in ‘A’-RPs is greater than the importance of AC -loss, although in these RPs, the AC -turnover was accelerated. On the contrary, AC-loss in ‘H’-RPs (although their AC-turnover was decelerated) is more important for pain and disability than changes in SB.
The significant influence of gender on the values of the clinical, laboratory and radiographic indicators was clearly shown - disease duration was different in the different RGs and RPs but also between men and women of the same RG/RP. Men and women of the same RG/RP had SSD in the median values of all CPs, LPs and BMDs at all measurement sites (PF-BMD; LS-BMD; TB-BMD). On the other hand, men and women with similar values of the CPs had SSD in mJSW. The explanation of these facts is that: (1) Women had lower values of JSW and BMD at baseline in all measurement points, which persisted after standartisation for age and BMI, with the median gender-related difference of 0.34 mm. for mJSW [57]; (2) Lanyon, et al. found a tendency towards а decrease in JSW with time in women but not in men [59]; (3) The gender related differences occurred also in the levels of cartilage (uCTX - II) and bone turnover (sCTX - I) markers and 25-hydroxy vitamin D levels [52-56]; (4) Several studies [60,61] exploring the gender differences regarding real estimate of health-related events and the search for medical help, have demonstrated a delay from days to months in the search of medical consultation in men depending on the pathology. All above-mentioned data explain the lower DD values reported in men, and the gender related differences in CPs/LPs/mJSW, all of which tend to persist and increase over time leading to the different rate of radiographic progression in men and women with the same RGs/RPs/age and BMIs. These considerations suggest that GD must be fixed with RG/RP and be equal in all patient groups when creating the design of a study in HOA.
During the follow-up, the natural progression of the NS group showed nothing unexpected. While the levels of cartilage and bone turnover markers were constantly increasing, CPs (PW and F) worsened over time, along with advance in the structural changes (decreases in mJSW) and the decreases in BMD at all measurement time points. After the first course, a brief (absent on M3), MCII response at M1-2 was recorded in K/L-II - 'H' and 'I'-RPs and K/L - III - 'H' (M1). After the second course a similar, brief (absent on M9) MCII response was recorded at M6, at this time also for the K/L - II'A' and K/L - III'A' -patterns. In addition, the response for K/L-II'H' -fulfilled the OARSI criteria for the same period (M6). The observed responses are probably the result of the cumulation from the manipulation’s placebo effect and the effect of the joint cavity lavage [18-20], enhanced after the second course again as a result of the expected improvement by the patient.
Efficacy of IA-CS - our results regarding the changes in efficacy over the time (onset of effect at week 1 (W1), decrease at W2-W12, disappearance of the effect after W12) and the dependence of the ES/ED on the degree of the morphological changes, were similar to the results presented in other studies [24,25,27,37]. The onset of action and the maximum effect in all RGs and RPs was at M1, but ES and ED depended on both - the radiographic grades and patterns. OARSI-responses in K/L - III‘I’- were not reached during the first course and in K/L -III ‘H’, were sustained only for 1 month, as compared to the K/L-II ‘I’ and ’H’-patterns. The initial decrease in the ES (for both grades and three patterns) was detected as early as M3, but the decrease was much slower in ‘H’ as compared to ‘I’ -RPs.
Efficacy of MMW-HA - our results regarding the changes in efficacy over the time - onset of action at M1, increase at M1-M2 due to viscosupplementation (VS) and at M2-M3 due to viscoinduction (VI), decrease at M3-M4 (loss of VS) and at M4-M5 (loss of VI), as well as the dependence of the ES /ED upon morphological changes - were similar to that published in other studies [24,29,32-35,37]. Efficacy of MMW-HA was detected at M1, ES was small, almost equal to ES of NS (MMW-HA vs. NS - p = 0.655). The ES increased between M1-M3, reaching OARSI-responses at M2 (for all RPs with the exception of K/L-III‘A’).ES/ED again showed dependence on both (RGs/RPs) factors - the same as seen with IA-CS. In K/L-III ‘A’ - OARSI-responses were reached later at М3 and for just one month. The ES decreased for all RPs at M4 during the first course and after the 4 and 12 - th months (at М9 for III’A’-patterns and atM18 for II’H’-patterns) during the second course.
We found a “cumulation of the effect” with an increase of the ES and ED after the second treatment course for all types of treatment. This is due to the presence of а residual effect at M5 in 73% of the patients, excluding the NS group (according to principal investigator data from previous similar studies [75]). Being at this time point (M5), the second treatment course led to increase in the ES and ED - for all groups (even for NS-K/L-II ‘H’ - OARSI responses were reached at M6). Again - the “cumulation of the effect” showed the same double dependence on RGs /RPs noted above. The initial decrease in the ES for MMW-HA was detected four and twelve months later (K/L-III’A’ -at M9; K/L-II’H’ - at M18) as compared to first course.In the IA-CS group, the initial decrease in ES was detected as early as M8, but the rate of decrease was slower compared to that after the first course (for both RGs) and different between 'H' and 'I'-RPs.
The appearance of changes in CPs preceded changes in RIs due to the presence of a placebo effect of the manipulation and joint lavage effects [18-20], mentioned above and common to all treatment groups in addition to the effects characteristic of IA-CS and IA-HA.
The time to occurrence of SSD in clinical and radiological indicators between radiographic patterns of the same radiological grade, under the different IA-therapies shows a tendency of IA-CS to shorten the time of natural progression (represented by the NS-group) in contrast to IA-HA, which shows tendency to extend this time.
In the CS group , we observed an earlier emergence of differences between the individual RPs due to accelerated bone and cartilage turnover of 'I'-RPs compared to 'H'-RPs of the same group. Changes in BT and CT markers (compared to baseline) were found at M3 after the first course, sustained until M5 (second course) with a new acceleration that persisted until M24, when significant differences in BMD and JSN were found, followed by similar ones SSD in mJSW at M36 ("H" vs. "I").
In contrast in MMW-HA group , we observed delayed bone and cartilage turnover, of 'A' and 'I'-RPs versus 'H'-RPs. Significant changes in BT/CT markers (compared to baseline) were found at M12 (K/L-III) and M24 (K/L-II), accompanied by analogous ones in all CPs. SSD changes in BMD and JSN (‘H’ vs. ‘I’ vs. ‘A’) were observed at M36 (K/L-III) and M48 (K/L-II), followed by similar ones SSD in mJSW at M48 (K/L-III) and M60 (K/L-II).
This finding suggests that the effect of IA-CS is strongest over grades K/L-II and 'H'-RPs, which have the slowest natural progression, in contrast to IA-HA, where the benefits are most pronounced in K/ L-III stages and 'A'/'I'-RPs - those with the fastest progression. We can draw the same conclusions from the analyses of the dropout patients (horizontal and vertical comparisons mentioned in resultssection). Unfortunately, due to its rapid natural evolution, the benefits for the ‘A’-RPs remain unrecognized especially in the absence of proper study design and follow-up.
The impact of ‘RP’ on outcomes obtained in hip OA studies is confirmed in addition to the results of our study and the results presented by Ledingham, et al. [40,41] and Dougados, et al. [42], Conrozier, et al. [43,44], regarding the prevalence of the radiological patterns (‘А’-10%; ‘Н’-30%; ‘I’-60%) and the variability in the values of the indicators (up to 35% higher values of pain at walking for ‘A’-patterns and up to 35% lower values of same indicator for ‘H’-patterns). Regarding the impact of the ‘RP’ on radiographic progression of HOA this also has been noted in a number of studies [41-43,47,67].
By using multiple linear regression, the dependence of radiographic progression on both factors - RG and RP was proven. Our study showed that in a fixed moment of time (i.e., M12), RG is a factor with a greater influence than RP, but the significance of RP increases with observation time (M12 à M36), especially bearing in mind the multiplication of ‘meaning of RP’ at each of the transitions (‘H’ vs. ‘I’ vs. ‘A’). This time-increasing influence of the 'RP' indicator on radiographic progression is probably the reason for the time-observed differences in clinical, laboratory and radiographic indicators between the different patterns (mentioned above).
This explains the necessity of taking into consideration the indicator - ‘RP’ when creating the design of a study in order to obtain reliable results. But it is important to remember that the ‘RPs’ of the HOA reflects the changes mainly in the SB, i.e. their meaning is different depending on the type of therapeutic intervention.With interventions directly influencing the SB (therapies with bisphosphonates, strontium ranelate, teriparatide, calcitonin, oateoprotegerin) - the changes in SB occur faster and are significant, the importance of RPs is more pronounced and is demonstrated earlier [48,76,77]. On the contrary - with interventions influencing mainly AC (IA-HA, IA-PRP -platelet rich plasma, mesenchymal stem cells -MSCs) [24,29-37,78-83] or ST /SS - the smoldering synovitis (IA-CS, methotrexate, anti inflammatory cytokines) [23-27,84-86] - the changes in SB are delayed in time and not so obvious, and the influence of RPs on the obtained results occurs later in time and is not so dramatic.
It would be difficult to compare the results from our study to these from other studies due to the lack of a baseline cross-sectional analysis in the latter and to the fact that neither of the ‘high quality’ studies [24,36,37], cited in meta-analyses and official OARSI/ACR guidelines, applied the above-mentioned homogenisation of patient groups according to the radiographic grade, radiographic pattern and gender distribution:
In the studies of Qvistgaard, et al. [24], Richette, et al. [34], Atchia, et al. [37] - each treatment group included patients from at least 3 - radiographic grades (K/L -II, III, IV [24, 34]) Croft I-IV [37], not considering the fact that IA-HA is not effective in the late stages of advanced morphological changes (RG IV according to K/L or Croft) which ones are absolutely indicated for elective THR. Groups homogenisation was performed according to the: (1) ‘mean age’ (with a SD of more than 14 years /35-75/ in all of cited studies -which, apart from the influence of the age factor, automatically raises the question of how mild dysplasia’s are excluded from presence in the patient’s groups); (2) ‘partial gender homogenization’ - According to the total number of women/men in the groups, but the radiographic grades of the different genders was not described; (3) ‘BMI - homogenisation’ - was also partial (SD more than 12 kg - in all of cited studies [24,34,37], despite the well-known impact of every 8% of weight gain/weight loss on PW values and radiographic progression over 5 years [87]; (4) ‘’synovitis’/’joint effusion’ was present in different percentages of patients in the studies of Qvistgaard, et al. [24] and Atchia, et al. [37], despite its known impact on the effect of the IA-CS /IA-HA therapies used; (5) indicator - ‘RP’ - was not applied in any of the above-mentioned studies. All these gaps lead to a very big standard deviation (within the groups and between the groups) from the mean values of the different clinical and radiological parameters both at baseline and during the follow - up (during which the modifying effect of all mentioned factors is multiplied).
Our study has some limitations that should be addressed. One of them is the small number of bone (only sCTX-I) and cartilage (only uCTX-II) turnover markers, which cannot adequately describe the complex and composite mechanism of processes occurring in AC/SB elements forming the OCJ. Another limitation stems from the manual measurements of JSW at three points to calculate mJSW/JSN rather than MRI-based estimates of AC volume changes, and of course, the two-dimensional nature of DXA measurements can be enhanced with the inclusion of three-dimensional (QTC) imaging modality.
The observed SSD in CPs, LPs, BMD and mJSW between endmost RPs at baseline and between all RPs during the follow-up - support the existence of distinct subgroups of HOA, the ones associated with individual RPs, each of them with their specific characteristics of the main pathogenetic mechanisms (AC-destruction, SB-remodeling) determining the differences in their clinical and radiographic progressions and their different response to the same intra-articular therapy. Proper time allocation of the second course led to cumulation of the effect with an increase in ES and the duration of the registered OARSI-responses for all groups with a symptomatic effect for IA-CS and probabledisease-modifying effect for MMW-HA valid for all three RPs of both RGs.
Considering the limitations of our study and the large socio-economic impact of hip osteoarthritis, larger randomized controlled trials with appropriate design, sample size, and duration should be conducted.
We are attaching a PDF copy of the original patent for the design used in this study.